The Statistics of Women's Suffrage
Give Them a Chance. comp by Regan, Laura Carr, Lyricist [Denver, Colo.: Laura Carr Regan, ©, 1926] Notated Music. Retrieved from the Library of Congress, <www.loc.gov/item/2017562208/>
In the Library of Congress, there exists a bounty of resources alluding to the development and achievement of women’s suffrage. Collections like the Blackwell Papers and the documents from the Women's Suffrage Association tell an enriching narrative that illuminates the struggle for women’s suffrage.
But it wasn't just the words and stories of suffragists that led to the ratification of the 19th amendment in 1920. A great wealth of this story arises in the analysis of the data and the ways in which that data was manipulated from suffragists and anti-suffragists alike. This article seeks to serve as a primary source exploration, offering questions one might ask to critically examine these statistics, often presented as objective fact.
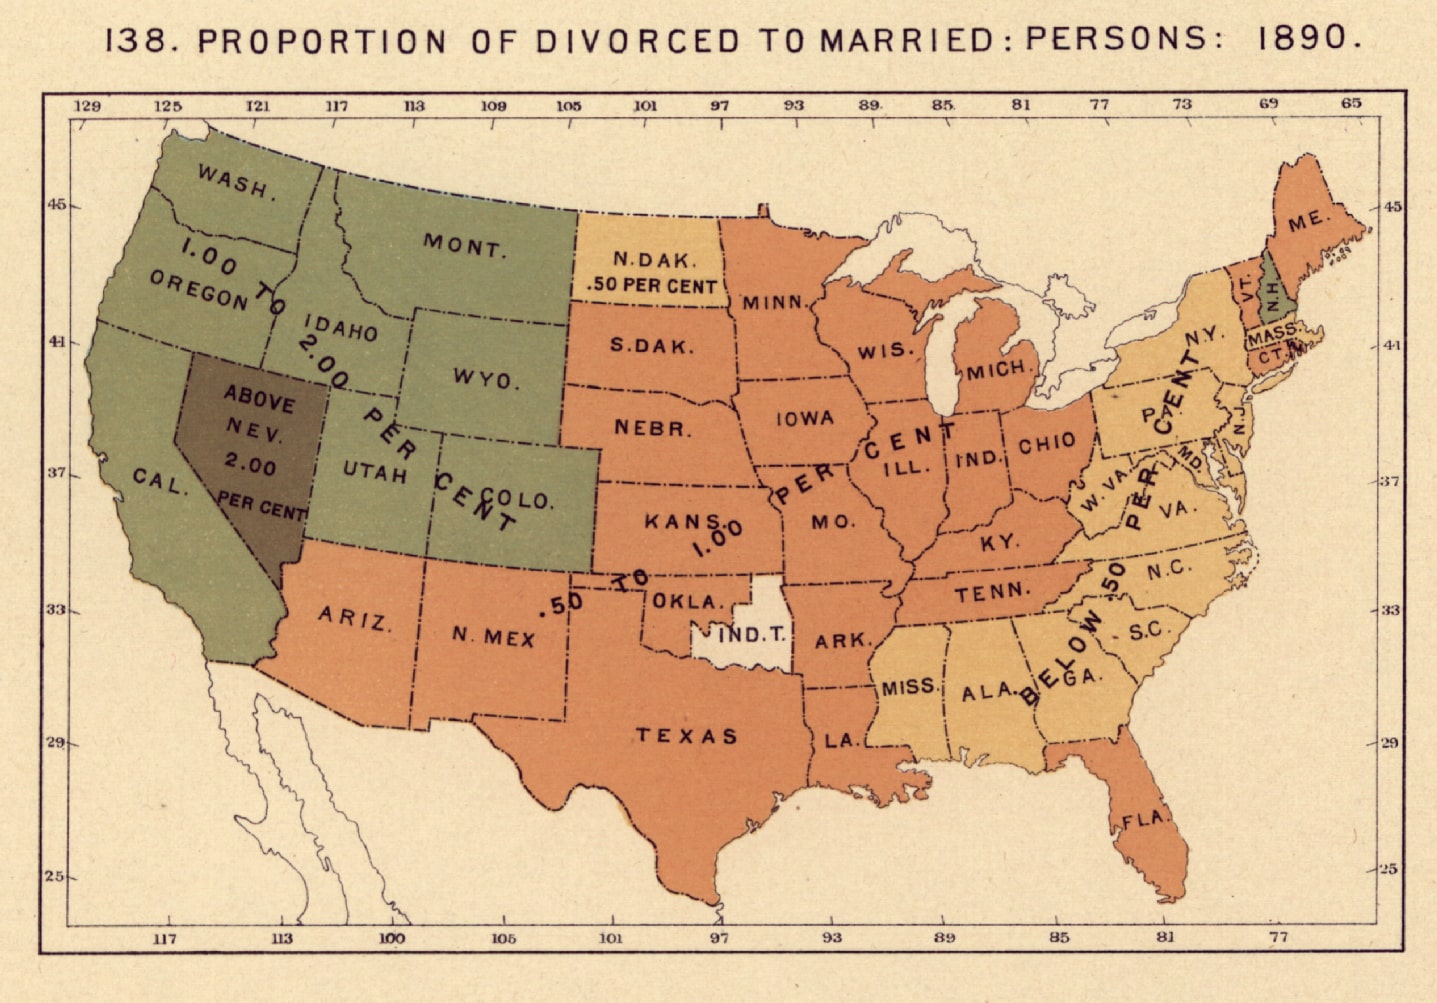
United States Census Office. 11Th Census, 1890, and Henry Gannett. Statistical atlas of the United States, based upon the results of the eleventh census. Washington, Govt. print. off, 1898. Map. Retrieved from the Library of Congress, <www.loc.gov/item/07019233/>.
The first analysis, which will "set the scene" of this conversation, comes from the 1890 Census, approximately three decades prior to the ratification of the 19th amendment. This map color codes the United States by proportion of gender, orange representing an "excess" of men, and pink representing an "excess" of women. With this map, learners can engage in meaningful discussion, possibly using modeled questions from the Map Primary Source Analysis Tool.
- What may have been the purpose of gathering this data specifically? What potential benefits would it serve to have this information?
- How does the manner in which the data is presented skew our perceptions of it?
- What aspects of this map leave you with more questions than answers?
In complement to the map above, the sheer level of this disparity can be viewed through another visualization provided within the same document, highlighting the ratio of male to females in various states:
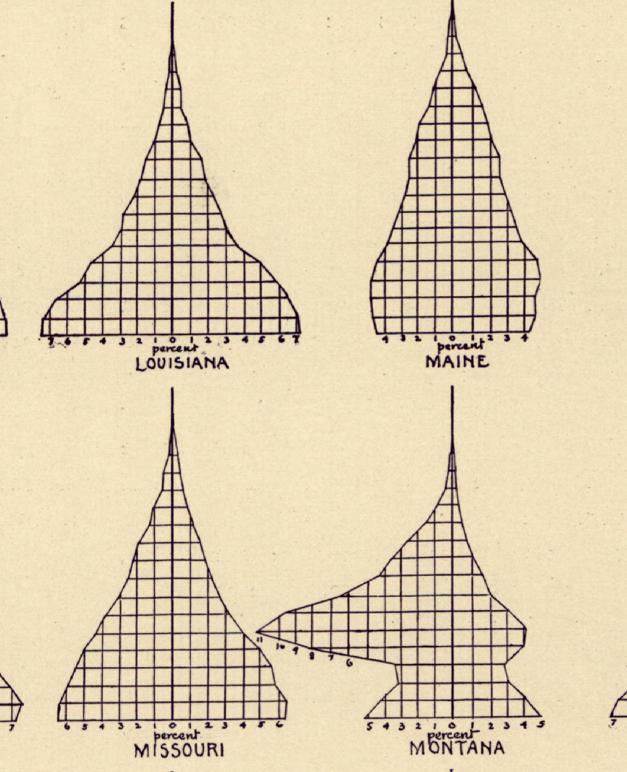
United States Census Office. 11Th Census, 1890, and Henry Gannett. Statistical atlas of the United States, based upon the results of the eleventh census. Washington, Govt. print. off, 1898. Map. Retrieved from the Library of Congress, <www.loc.gov/item/07019233/>.
In the western state of Montana, the difference between the male and female population is so great that it breaks the visualization of their data, intruding on the data for Missouri. Have students consider why this data may be so askew, and implications that may arise from their conclusions.
Then, when appropriate, draw from these conversations in relation to women's suffrage as a topic. Ask learners to consider how these statistics contribute to the fight for women’s suffrage... where do they expect it to first emerge? Where do they expect that it will receive the most resistance?
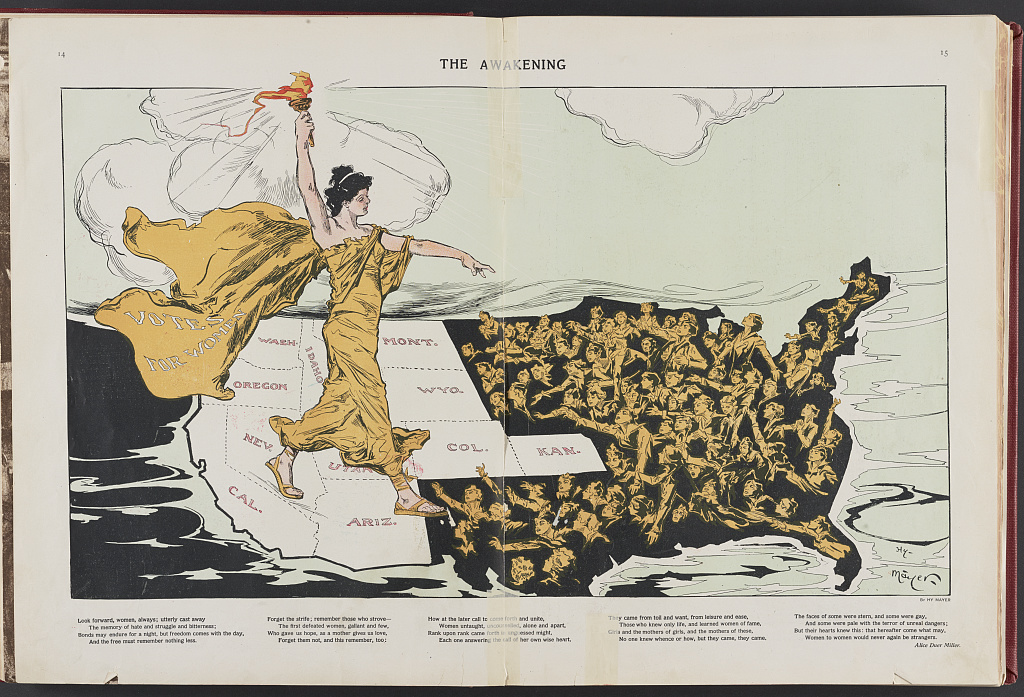
Mayer, Henry, Artist. The awakening / Hy Mayer. New York: Published by Puck Publishing Corporation, 295-309 Lafayette Street. Photograph. Retrieved from the Library of Congress, <www.loc.gov/item/98502844/>.
Once students have generated some thoughts surrounding this data, it could be beneficial to use a set of less data-heavy sources to help verify or challenge their assumptions. Consider using the above painting, created by Hy Mayer in 1915. Have learners analyze the imagery of this map to generate theories to its meaning. Consider using questions on the Political Cartoon Analysis Tool to stir discussion surrounding this image.
A separate group of students might examine the map below, which follows a similar theme, but provides a quite different narrative:
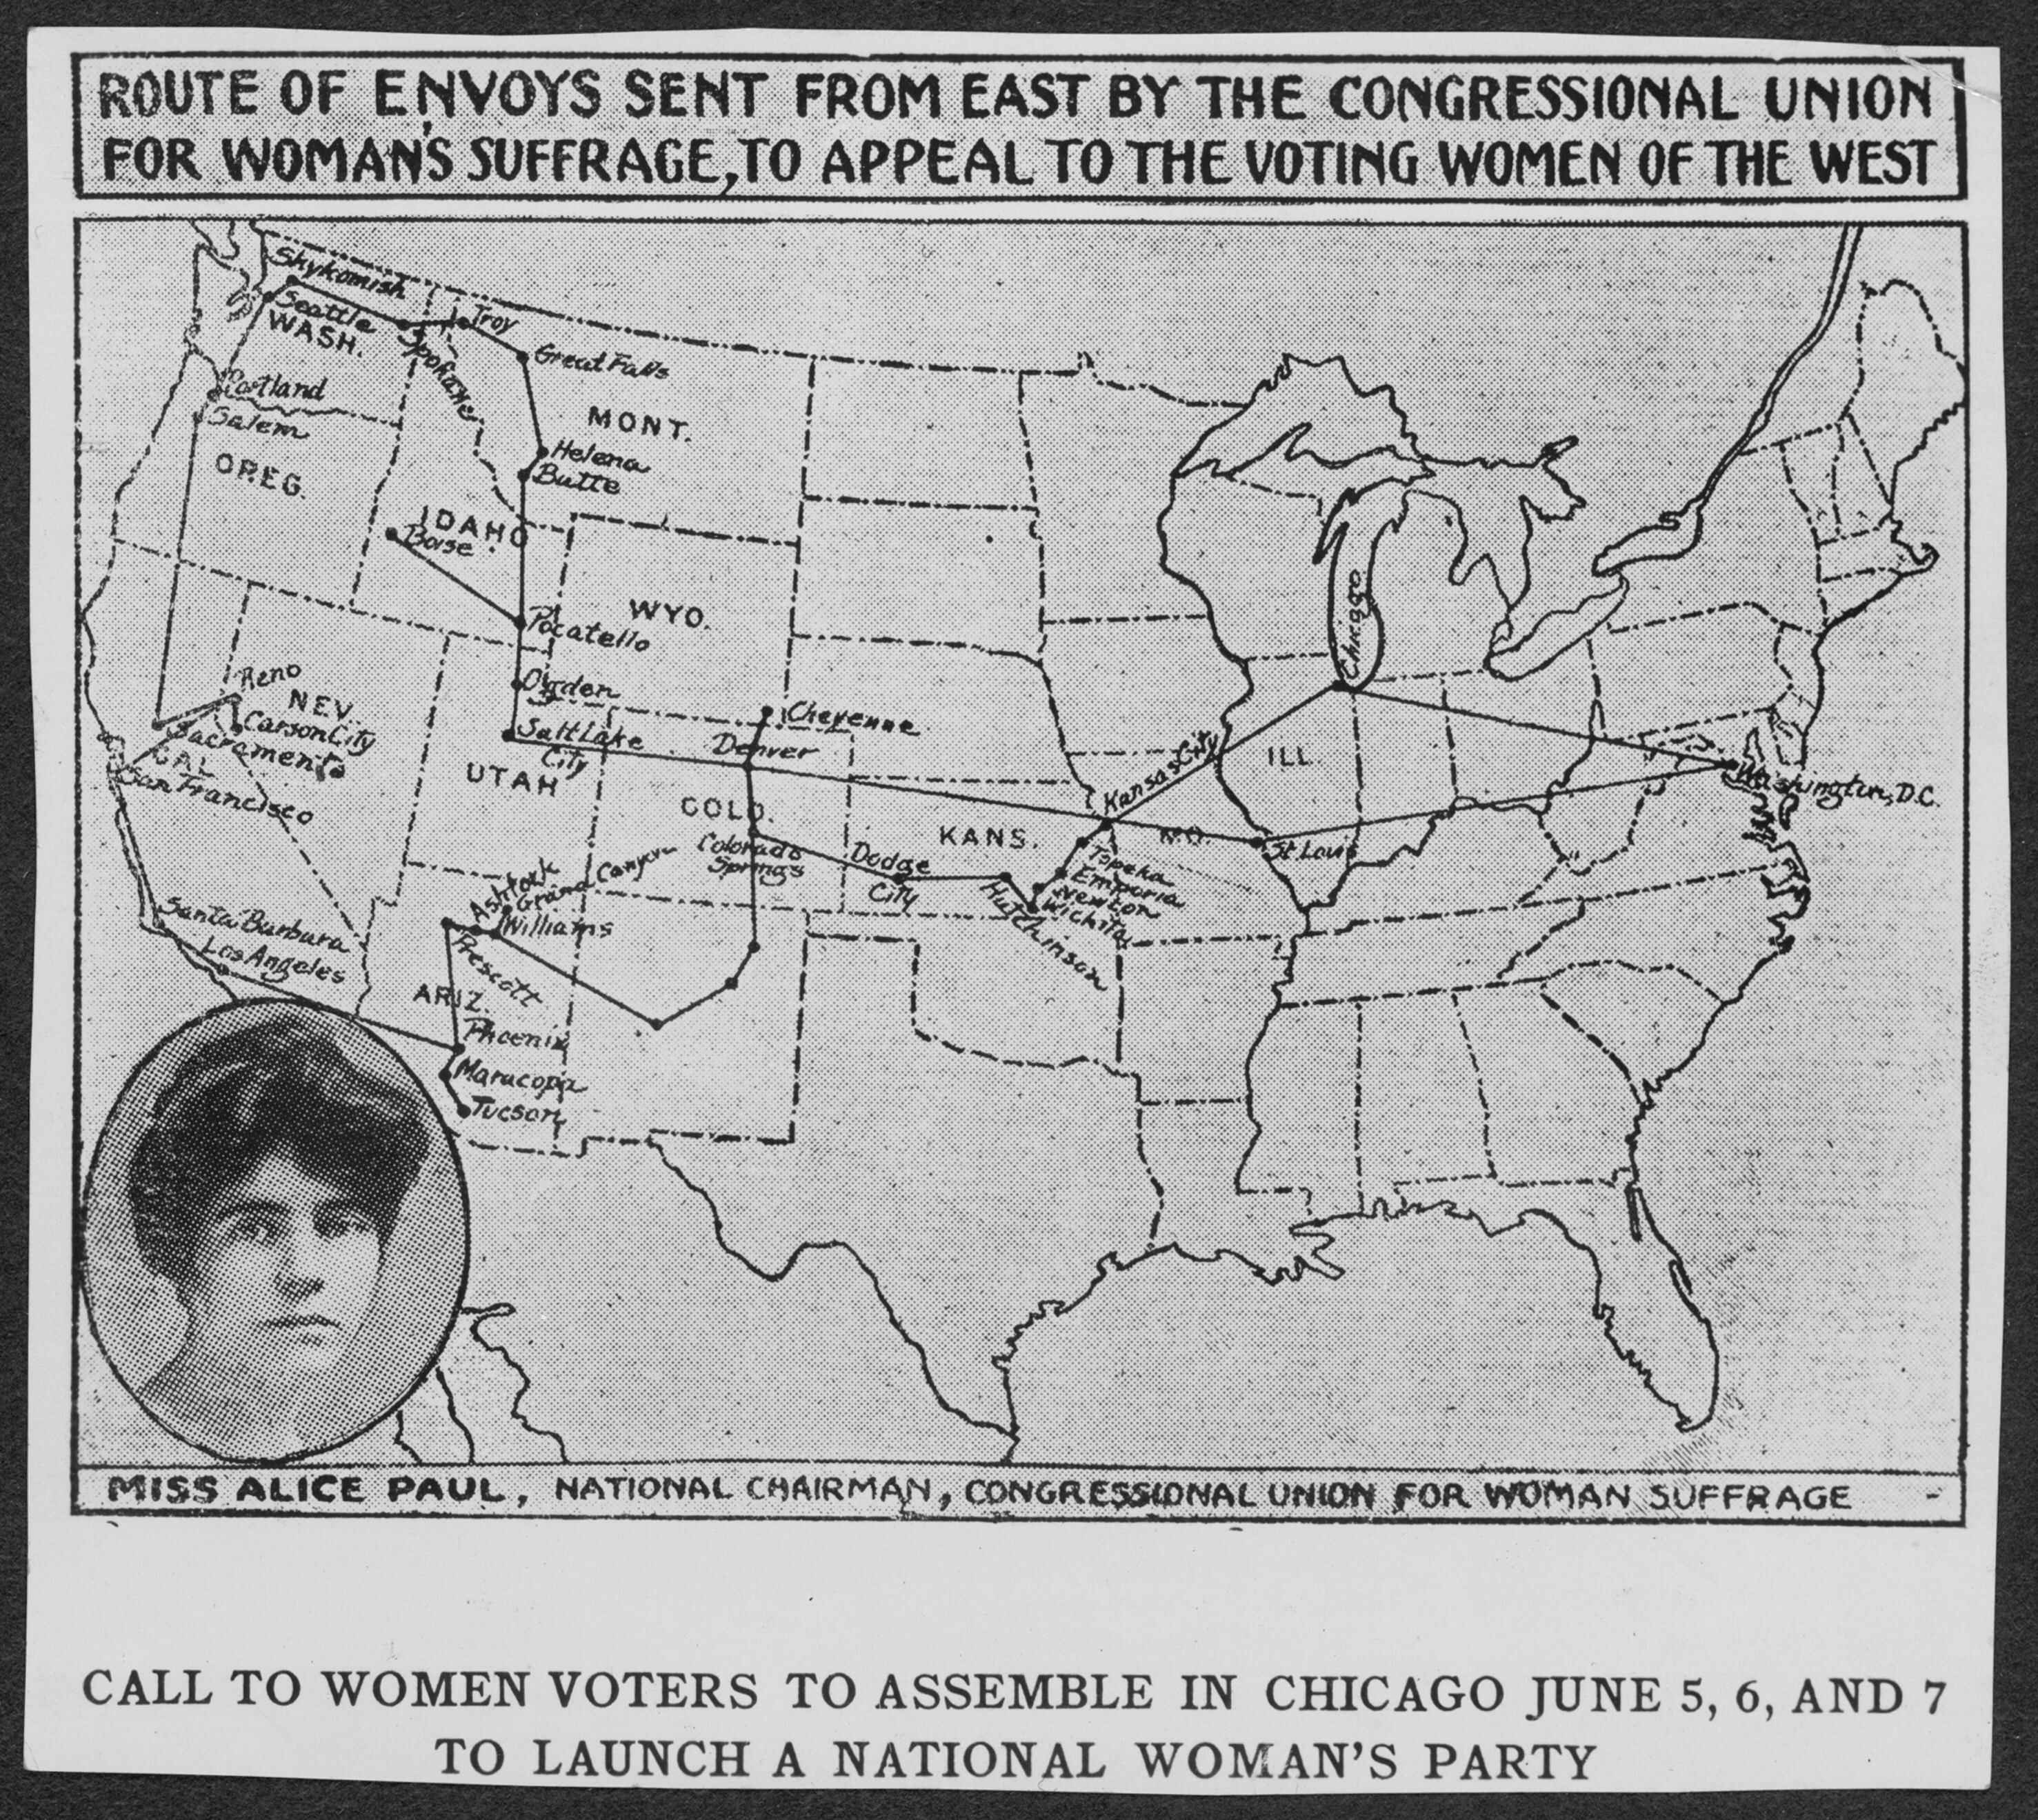
Map of Route of Envoys Sent from East by the Congressional Union for Woman's Suffrage, to Appeal the Voting Women of the West with inset portrait of Alice Paul. [Apr.-May] Photograph. Retrieved from the Library of Congress, <www.loc.gov/item/mnwp000270/>.
This map shows the routes by which women from the east traveled in a campaign to garner attention from the voting women in the west. When using these maps together, students will likely be able to deduce that women’s suffrage originated in the west, but the way in which it spread to the east is somewhat more contentious. From the former picture, the western woman “carries the torch” to the east, seemingly on her own volition. In the latter map, it is the women of the east who have begun to travel west in search of advocacy.
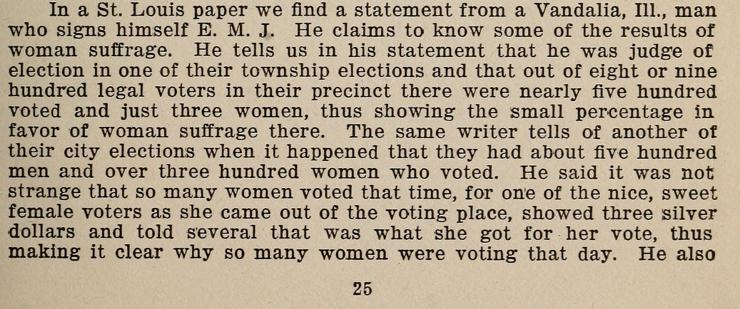
Of course, these statistics and images offer insights on how the fight for suffrage may have developed. But it's important to note that statistics is not just a tool by which to analyze the world. They can also be used as a tool to shape it. It was a common a practice to use statistics to oppose the fight for women's suffrage, as noted by the anti-suffrage documents below. A great many number of anti-suffragists published articles attempting to employ logic against the movement claiming:
- Women, statistically, had very little interest in voting. Supposedly, the only way to motivate them was to bribe them.
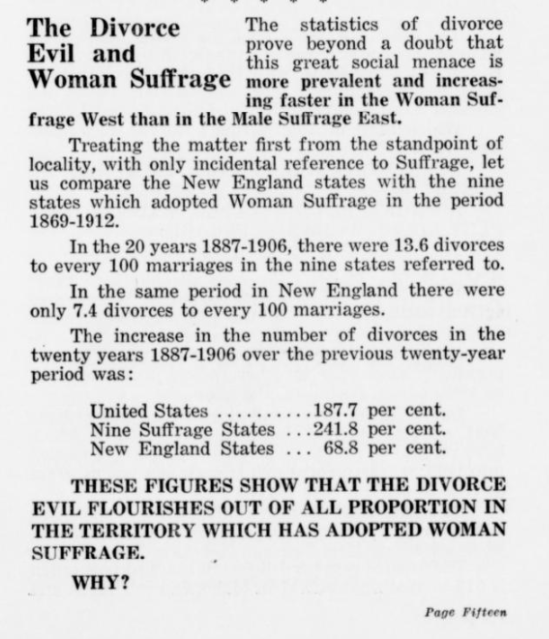
- States that had granted women's suffrage had significantly higher percentages of divorce than the states that did not.
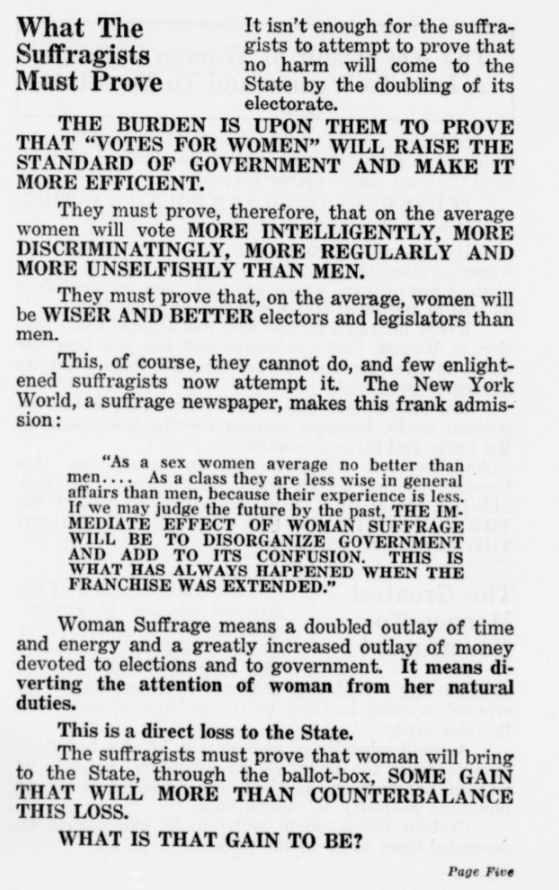
- Women voting, on average, will not improve the state of the government - only demand a greater allocation of tax dollars to elections for the same returns.
-
Walsh, Robert C. Anti-Woman Suffrage and Criticisms. [St. Louis, Wilson ptg. co, 1916] Pdf. Retrieved from the Library of Congress, <www.loc.gov/item/17010219/>.
-
National American Woman Suffrage Association. National American Woman Suffrage Association Records: Subject File, -1953; Antisuffrage literature; 30 of 36. - 1953, 1851. Manuscript/Mixed Material. Retrieved from the Library of Congress, <www.loc.gov/item/mss3413201335/>.
-
National American Woman Suffrage Association. National American Woman Suffrage Association Records: Subject File, -1953; Antisuffrage literature; 30 of 36. - 1953, 1851. Manuscript/Mixed Material. Retrieved from the Library of Congress, <www.loc.gov/item/mss3413201335/>.
-
National American Woman Suffrage Association. National American Woman Suffrage Association Records: Subject File, -1953; Antisuffrage literature; 30 of 36. - 1953, 1851. Manuscript/Mixed Material. Retrieved from the Library of Congress, <www.loc.gov/item/mss3413201335/>.
Interestingly, these documents can find support by the same 1890 census that is referenced above; the rate of divorce is notably higher in the Western states, many of those who had granted women suffrage. But does this author truly examine this data holistically? With learners, it could be worth considering:
- What other factors could be actively contributing to this statistic?
- Are there states that have a higher rate of divorce that have not yet granted women suffrage?
- What is the value of collecting this set of data in the first place?
United States Census Office. 11Th Census, 1890, and Henry Gannett. Statistical atlas of the United States, based upon the results of the eleventh census. Washington, Govt. print. off, 1898. Map. Retrieved from the Library of Congress, <www.loc.gov/item/07019233/>.
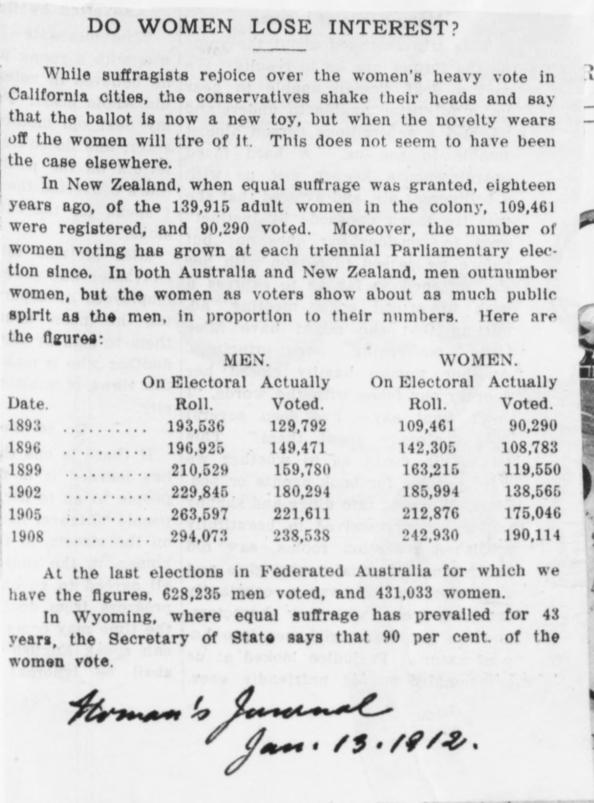
Supporters of the women's suffrage movement were quick to respond with a host of statistics of their own to address the above claims. To many, the idea that women would simply "lose interest" in the election was a preposterous stance, but unfortunately one that was difficult to argue against. After all, since women hadn't long been given the chance to vote, who was to say whether or not they would use it?
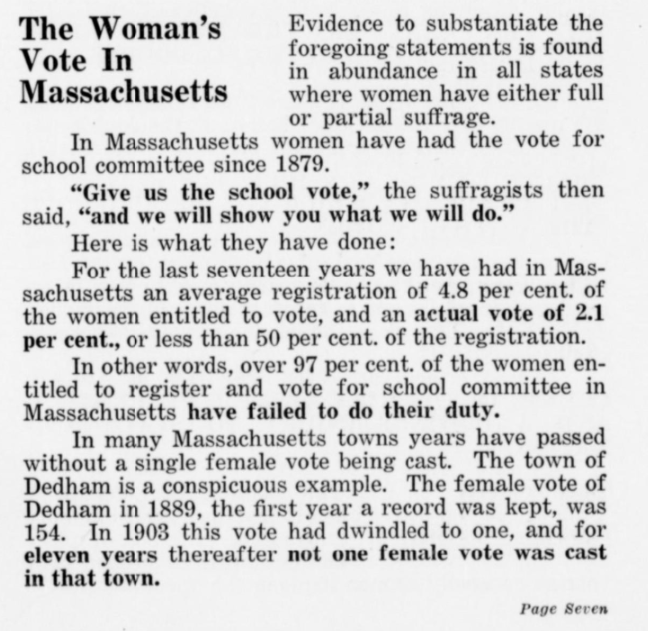
Consider having learners look at the following examples as a method of seeing how women attempted to support their claim that suffrage would not be wasted on them, should they receive it:
Blackwell Family. Blackwell Family Papers: Alice Stone Blackwell Papers, -1957; Miscellany.; Scrapbooks; 3 of 8. - 1957, 1848. Manuscript/Mixed Material. Retrieved from the Library of Congress, <www.loc.gov/item/mss1288000930/>.
National American Woman Suffrage Association. National American Woman Suffrage Association Records: Subject File, -1953; Björkman, Frances M. - 1953, 1851. Manuscript/Mixed Material. Retrieved from the Library of Congress, <www.loc.gov/item/mss3413201381/>.
National American Woman Suffrage Association. National American Woman Suffrage Association Records: Subject File, -1953; Björkman, Frances M. - 1953, 1851. Manuscript/Mixed Material. Retrieved from the Library of Congress, <www.loc.gov/item/mss3413201381/>.
Notably, the first of these passages, taken from the Blackwell Family Papers, must rely on the long-term statistics of New Zealand, the first "country" (though, not a country at this time) to grant women's suffrage. There was no longer term national data on which they could draw. As shown in the above documents compiled by the Women's Suffrage Association, what state data available was relatively recent, though showed overwhelmingly that women would exercise their right to vote if able. Even this data did not prove entirely useful, however, as it did not differentiate the votes between men and women.
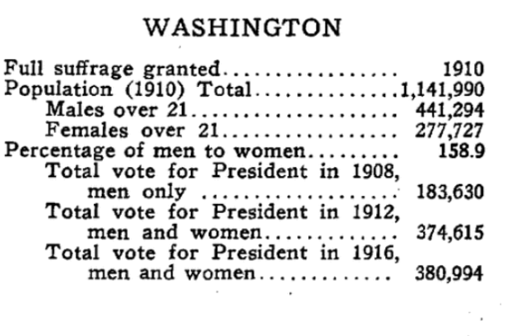
Statistics can also be used to examine a possible reason for the higher rates of divorce in those same Western states. Though not directly stated, reading the article below, published in New York by The Sun in 1915, can help offer insights as to a potential cause. With readers, identify the statistics identified within states that have granted women suffrage, and consider the implication that this data has on issues such as divorce rates.
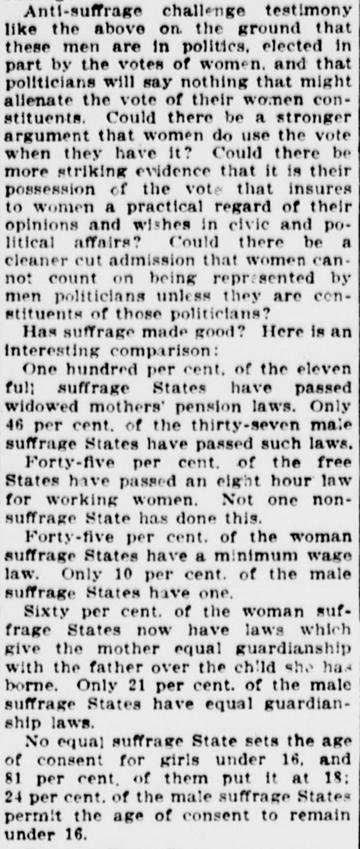
The Sun. (New York, NY) 23 May. 1915, p. 32. Retrieved from the Library of Congress, <www.loc.gov/item/sn83030272/1915-05-23/ed-1/>.
The article above also begins to reveal one of several reasons that such a strong anti-suffrage movement found itself building alongside the women's suffrage movement. In allowing women the right to vote, the disproportionate aggregation of power begins to right itself in equal guardianship, equal pension rights, and fair consent laws. Naturally, these laws offered protections to women that were somewhat unique to states that had granted suffrage. Divorce rates likely rose because it became a more viable option for women, allowing them freedom from relationships without losing access to their children or suffering utter financial ruin.
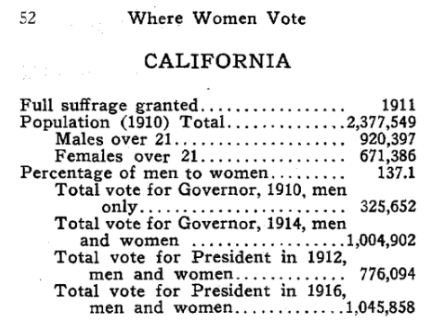
But the implications of these actions are much further reaching. In consideration of the two articles below, published in the Omaha Daily Bee in 1916, women being granted the right vote overwhelmingly increases the percentage in which each state participates in democracy. For the states that have granted suffrage, this is seen as a boon, as their voice becomes more prominent than those without suffrage. For the states in which suffrage is still a point of contention (mainly in the south), their already comparatively low voter rate seems to pale in comparison.
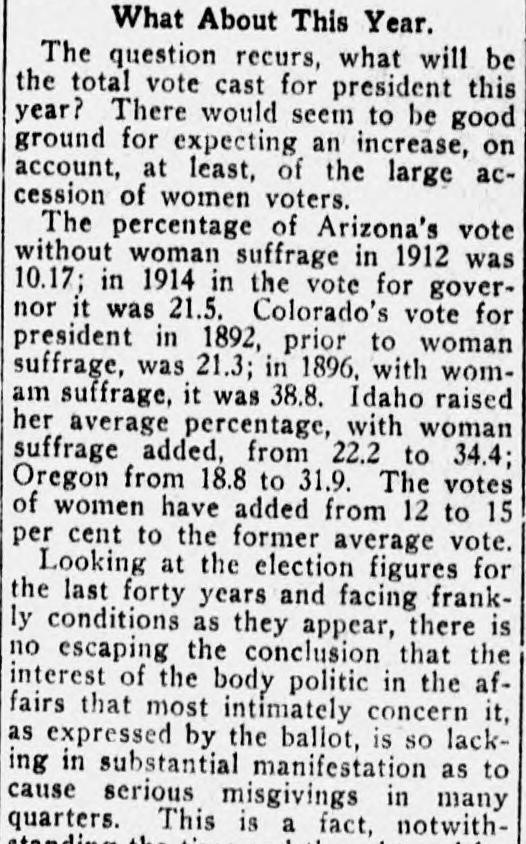
Omaha Daily Bee. (Omaha, NE) 6 Nov. 1916, p. 15. Retrieved from the Library of Congress, <www.loc.gov/item/sn99021999/1916-11-06/ed-1/>.
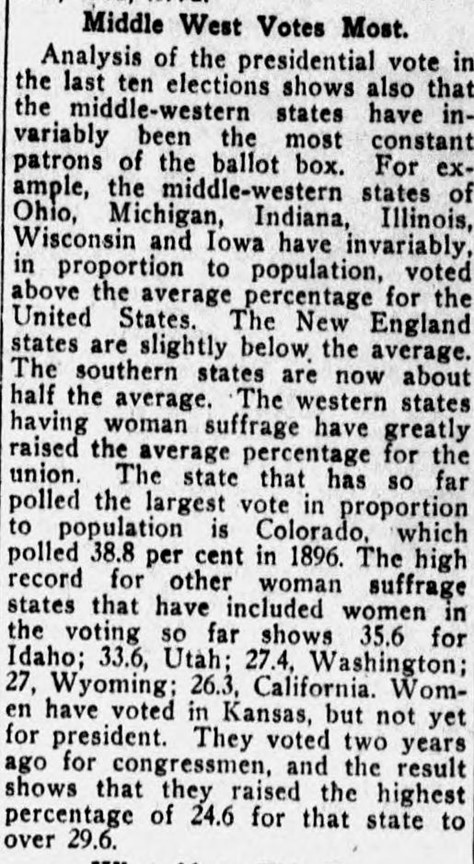
Omaha Daily Bee. (Omaha, NE) 6 Nov. 1916, p. 15. Retrieved from the Library of Congress, <www.loc.gov/item/sn99021999/1916-11-06/ed-1/>.
In essence, it’s important for students to recognize that political movements are not just based on ideology. Politics are also about which statistics people choose to collect, how they choose to collect them, and, most importantly, how they choose to interpret them. Data, though often presented as such, is not inherently neutral. It tells a story, not only of the means that it measures, but of the people that have elected to measure them. This is not new information. This was known to the women of this time period just as much as it is known today. Consider the words collected from another selection of the Blackwell Family Papers, which summarizes this thought better than I ever could:
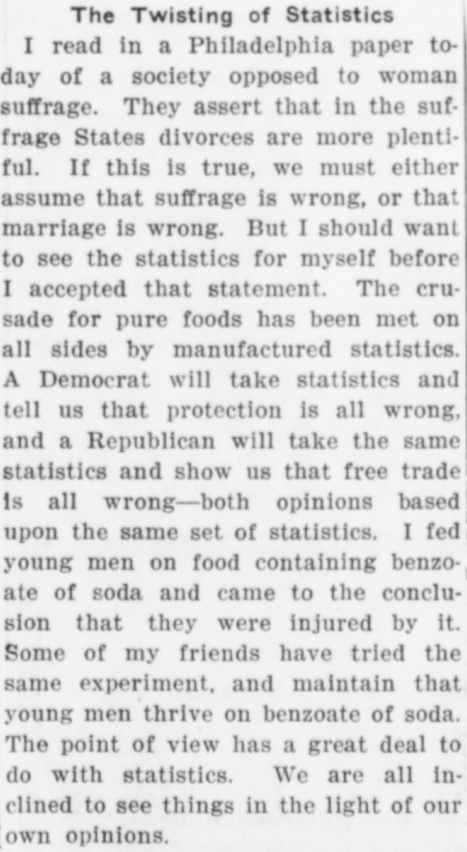
Blackwell Family. Blackwell Family Papers: Alice Stone Blackwell Papers, -1957; Miscellany.; Scrapbooks; 3 of 8. - 1957, 1848. Manuscript/Mixed Material. Retrieved from the Library of Congress, <www.loc.gov/item/mss1288000930/>.
A democrat will take statistics and tell us that protection is all wrong, and a Republican will take the same statistics and show us that free trade is all wrong - both opinions based upon the same set of statistics... The point of view has a great deal to do with statistics. We are all inclined to see things in the light of our own opinions.