Math, English, History - A Combination of Curricula
By: Joseph Skotzke
This June, the Teaching with Primary Sources Midwest Region will be exhibiting at the NCTE/NCTM Joint Conference in New Orleans, Louisiana! This conference seeks to help educators, primarily those in K-6 education, unite the disciplines of English/Language Arts and Mathematics under a single banner. As a program that seeks to empower and enrich the educators within our region, we sought to help provide resources for this connection.
But at the Midwest Region we figured: why not take it a step further? Within the digital collections of the Library of Congress, the opportunity exists to connect mathematics, literacy, and history under one umbrella by looking at how our forefathers used mathematics in a practical sense. Numbers, data, and equations formed the foundation of how America solved many of its problems, dictated the direction of its politics, and served as a measurable basis by which we might examine our country.
Below, I have identified several aspects of American history which could be explored at an elementary grade level that provides application of mathematics and history. With each, I found an accompanying book appropriate to the reading level of a grade within the K-6 range. I have provided a summary of each of these sets, as well as question clusters you might use to incite a larger conversation. However, if you would like to access the complete set of resources for each topic, click here for a free download!
Into the American West:
The first of these sets focuses heavily on the Early American West. By the time the United States began its expansion westward, many nations and territories had already laid their claims across much of what would later encompass the continental United States. Among these were Native American nations, Mexican territories, and even Russian settlements in the far west.
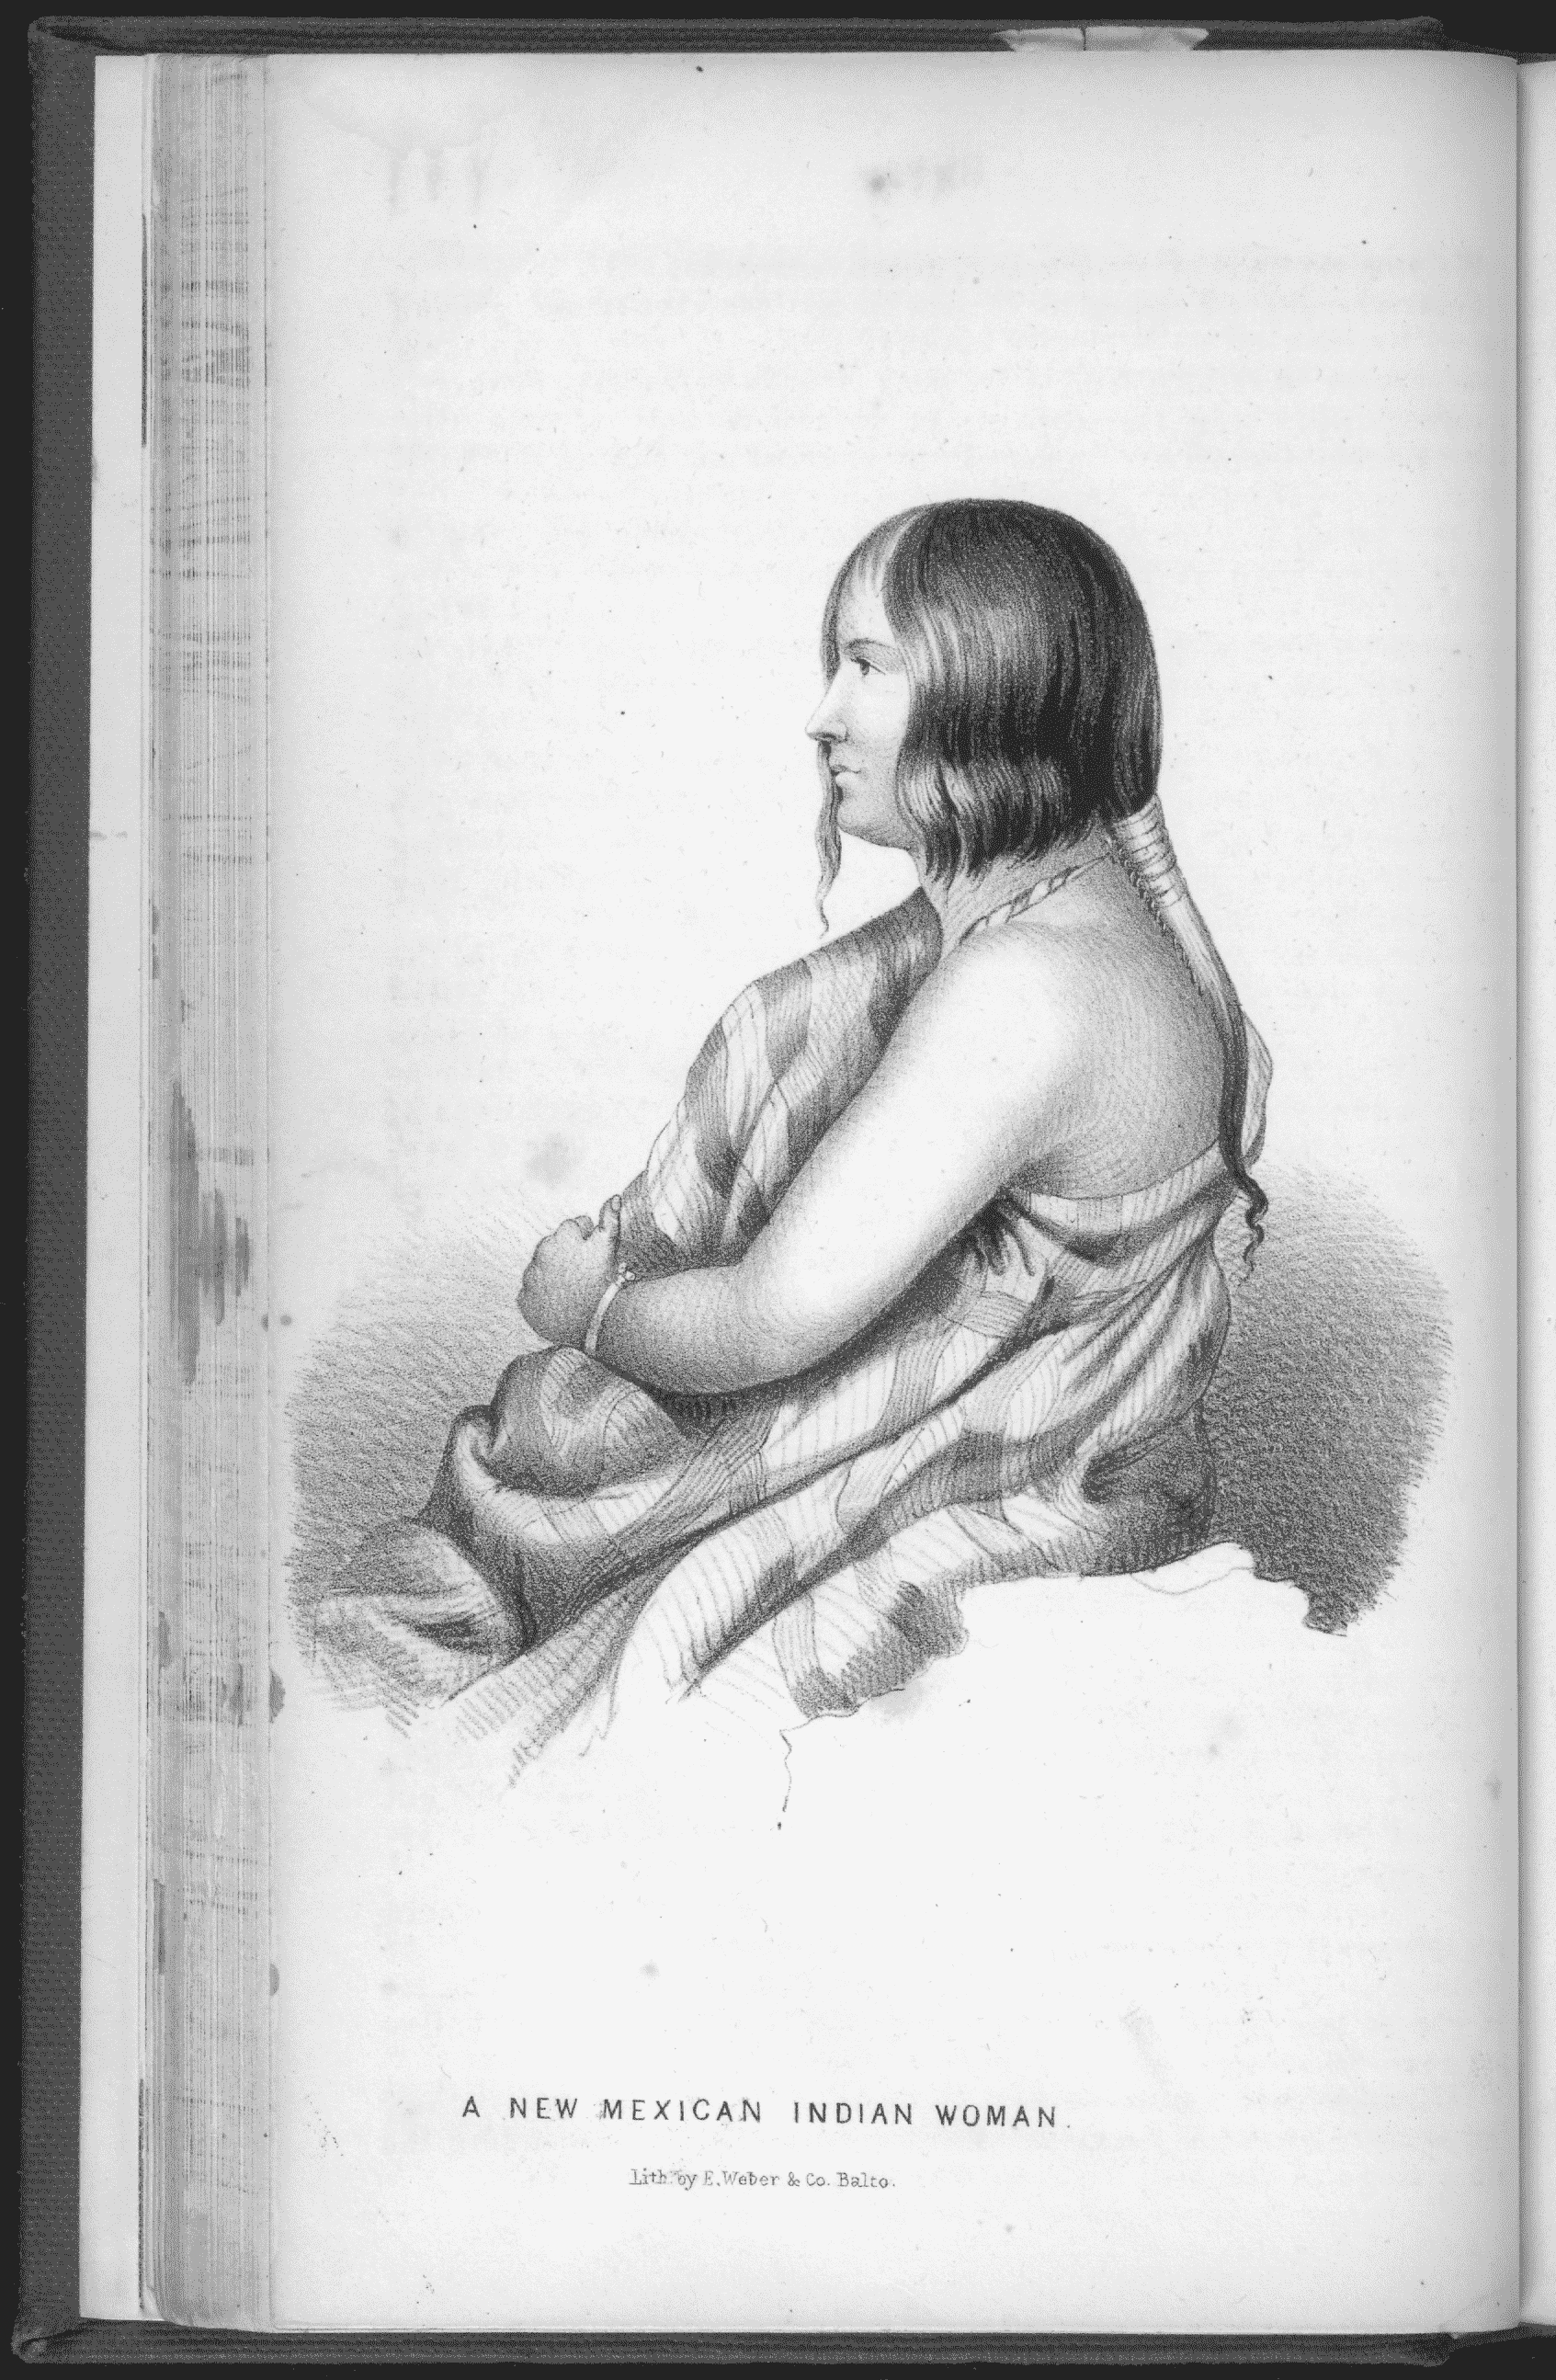
However, our diplomatic relations with these groups were historically poor. Consistent conflict arose against Native nations, and the Mexican-American War claimed tens of thousands of lives. Because these lands held both the dangers of an untamed wilderness and the residual influence of governing nations, it became essential that the United States measure both the natural and cultural climate of the landscape. During the height of the Mexican-American conflicts in 1846, Congress enlisted the assistance of William Emory to do just that. Composing Notes of a Military Reconnaissance, from Fort Leavenworth, in Missouri, to San Diego, in California, Emory sought to detail the political, military, and natural landscapes from the edge of Missouri alongside (and in some cases, through!) the Mexican border – all the way to California!
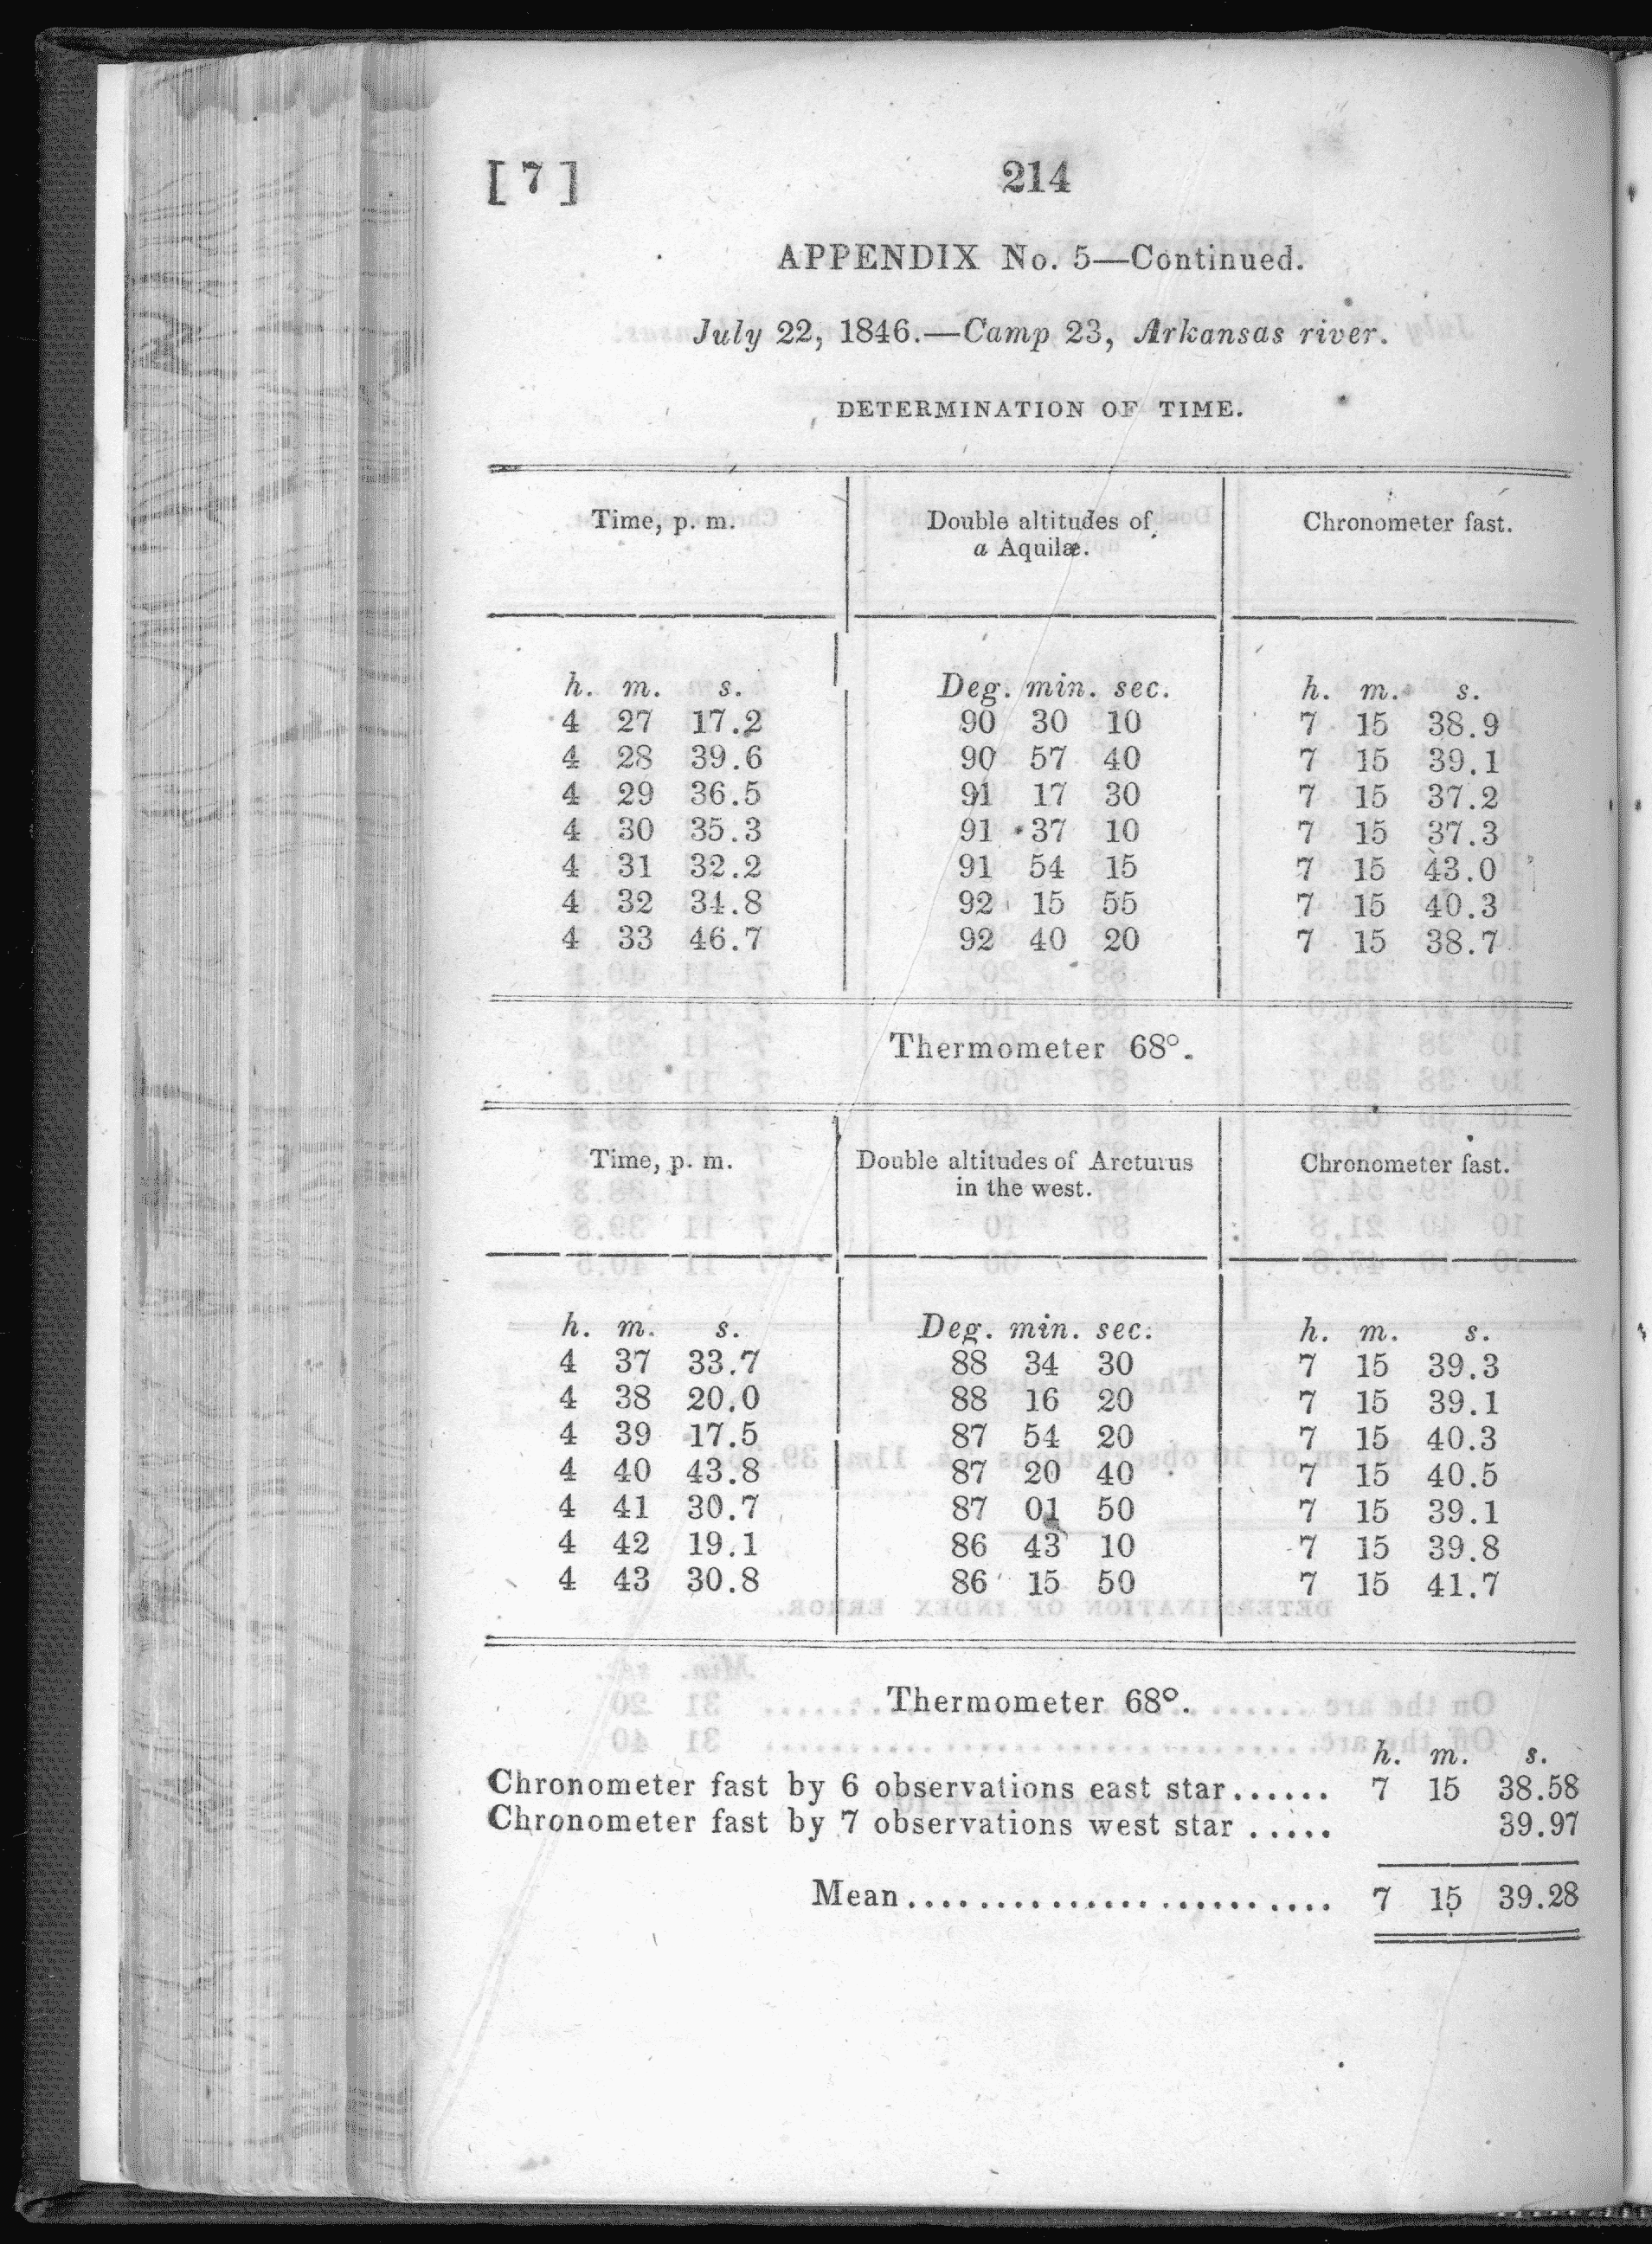
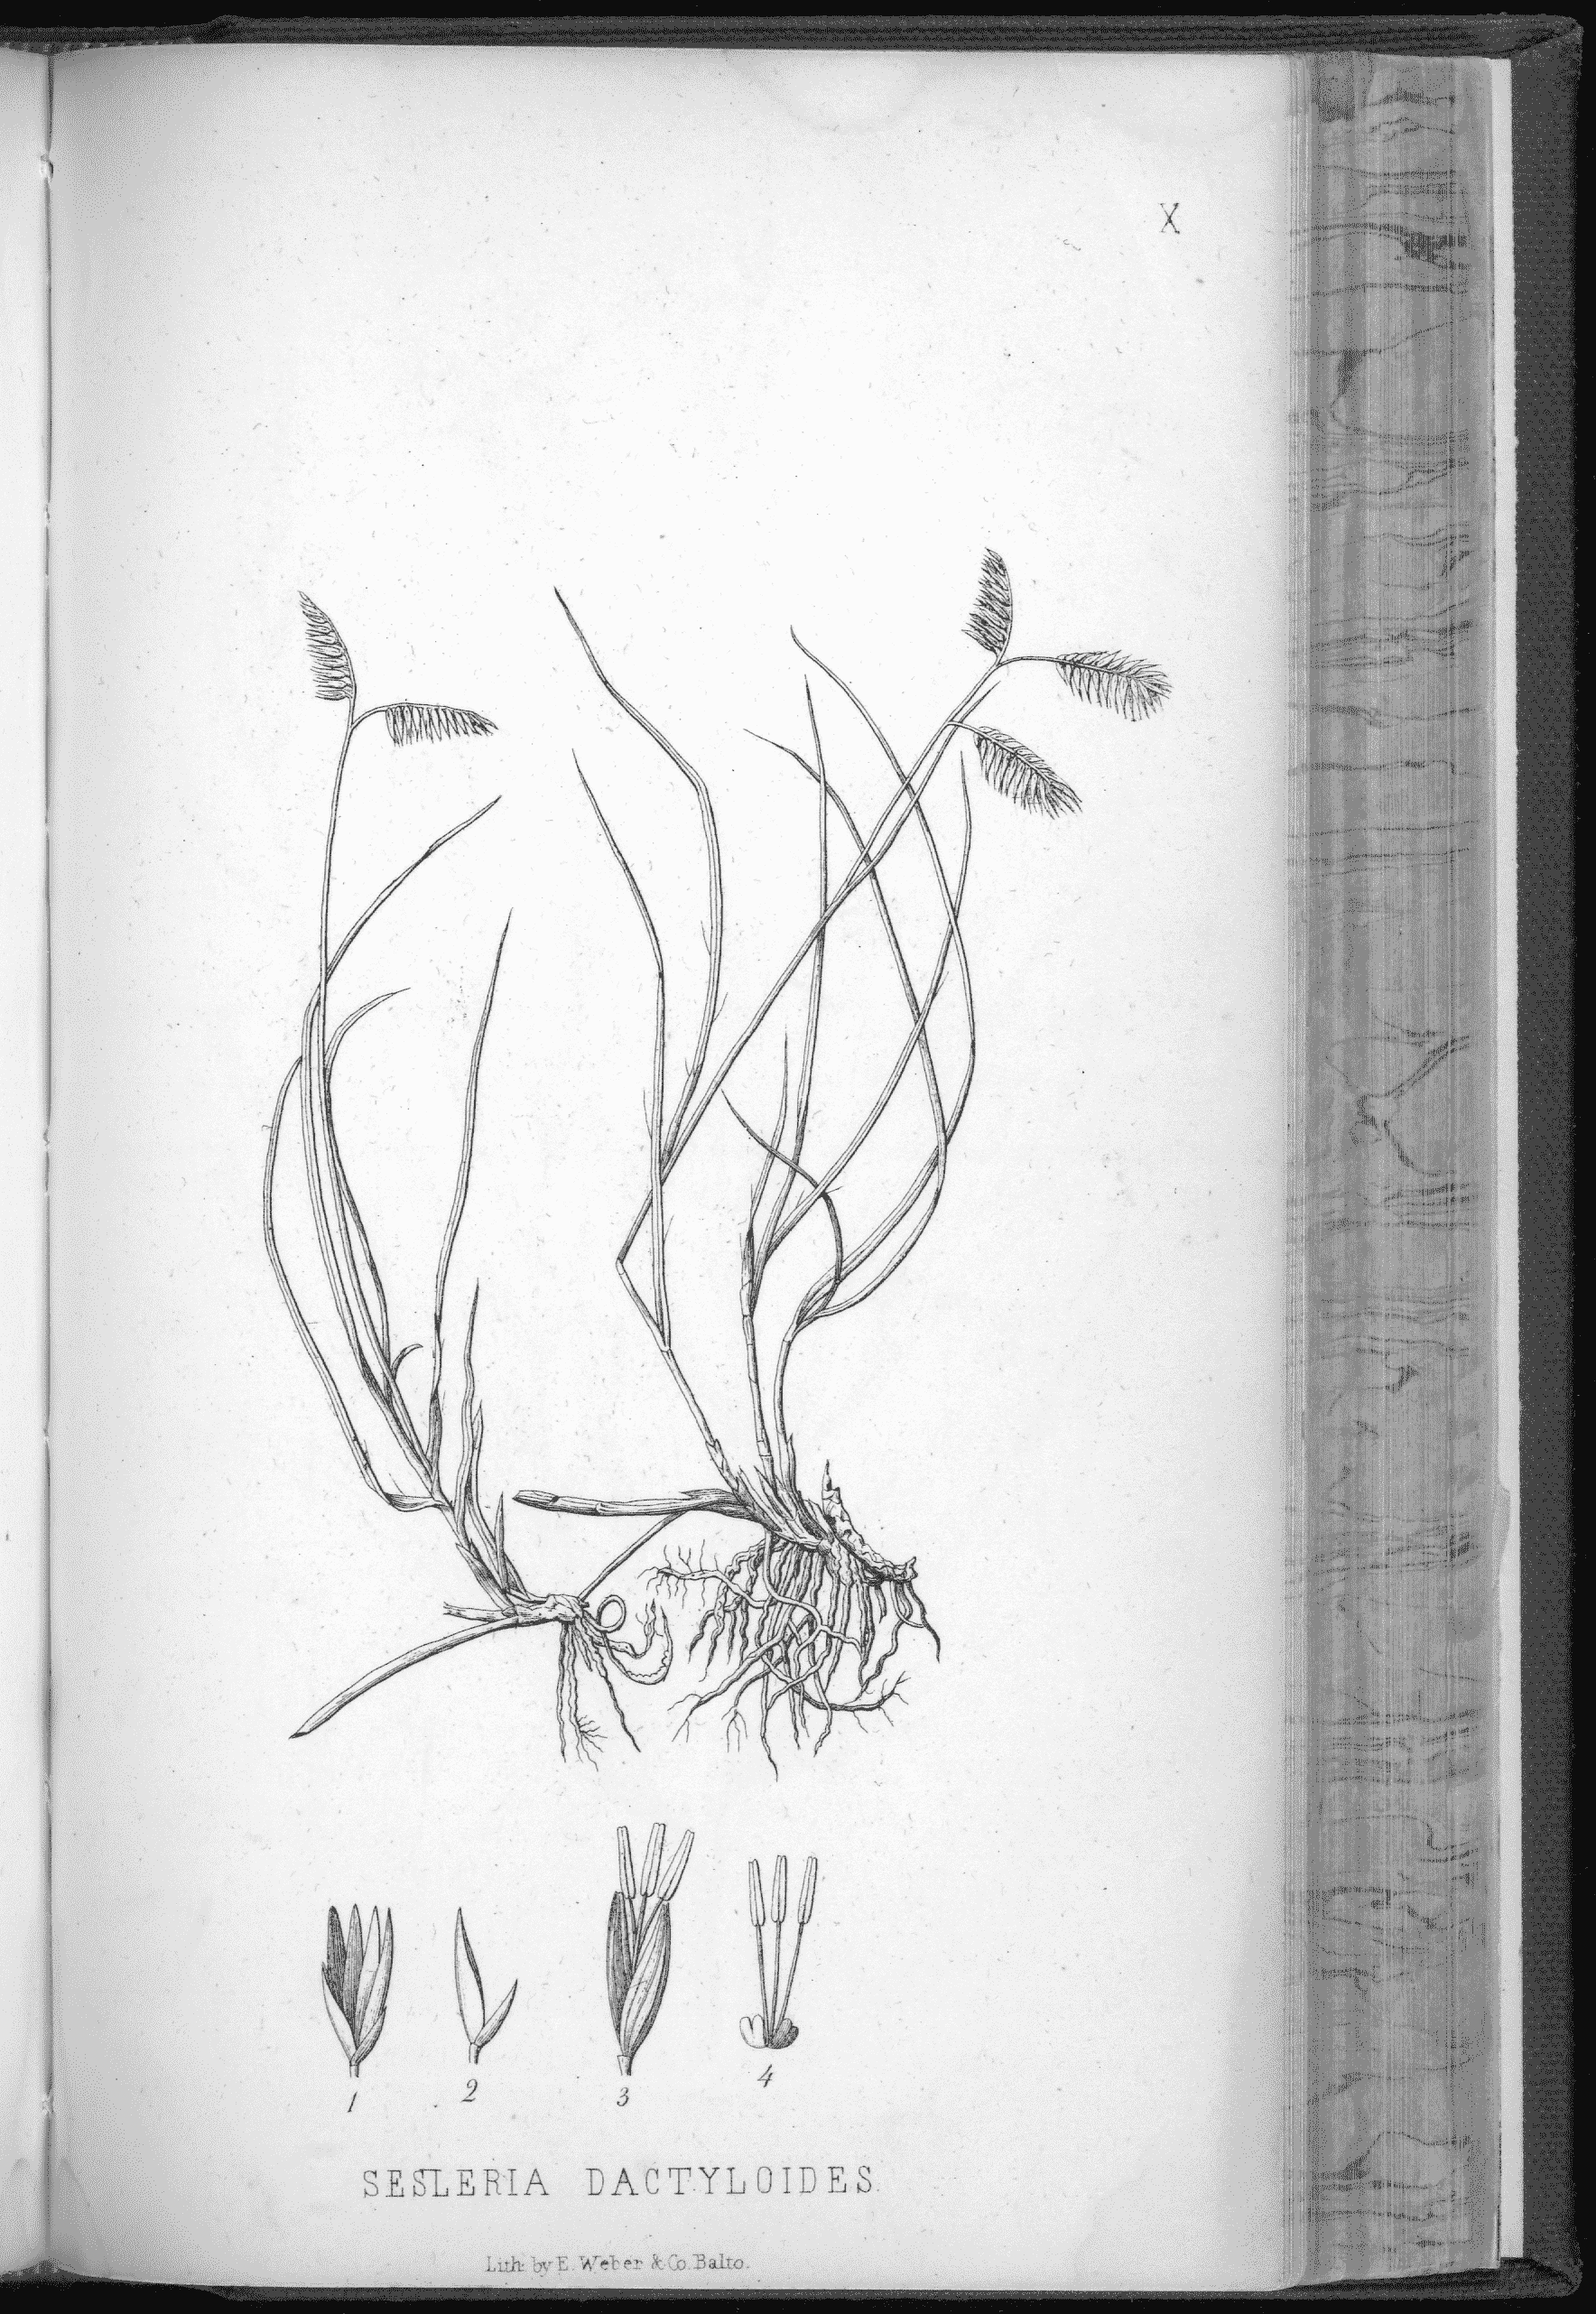
But it was not just soldiers that Emory enlisted to help him. Instead, he brought along a team of topographical engineers, scientists, and artists to help him take an exact account of their journey. He ensured that he recorded precise measurements of weather, time of day, height above sea level, latitude and longitude, fresh water sources, landmarks, and more. For all of these, he outlines the formulas and equations he uses to calculate these measurements, as well as the potential inaccuracies incurred by human error or treacherous terrain. Blended together with the scientific, Emory's team also drafted detailed and beautiful sketches of the flora and fauna of the region, as well as the significant cultural groups he encounters on his path with full narrative descriptions of their interactions.
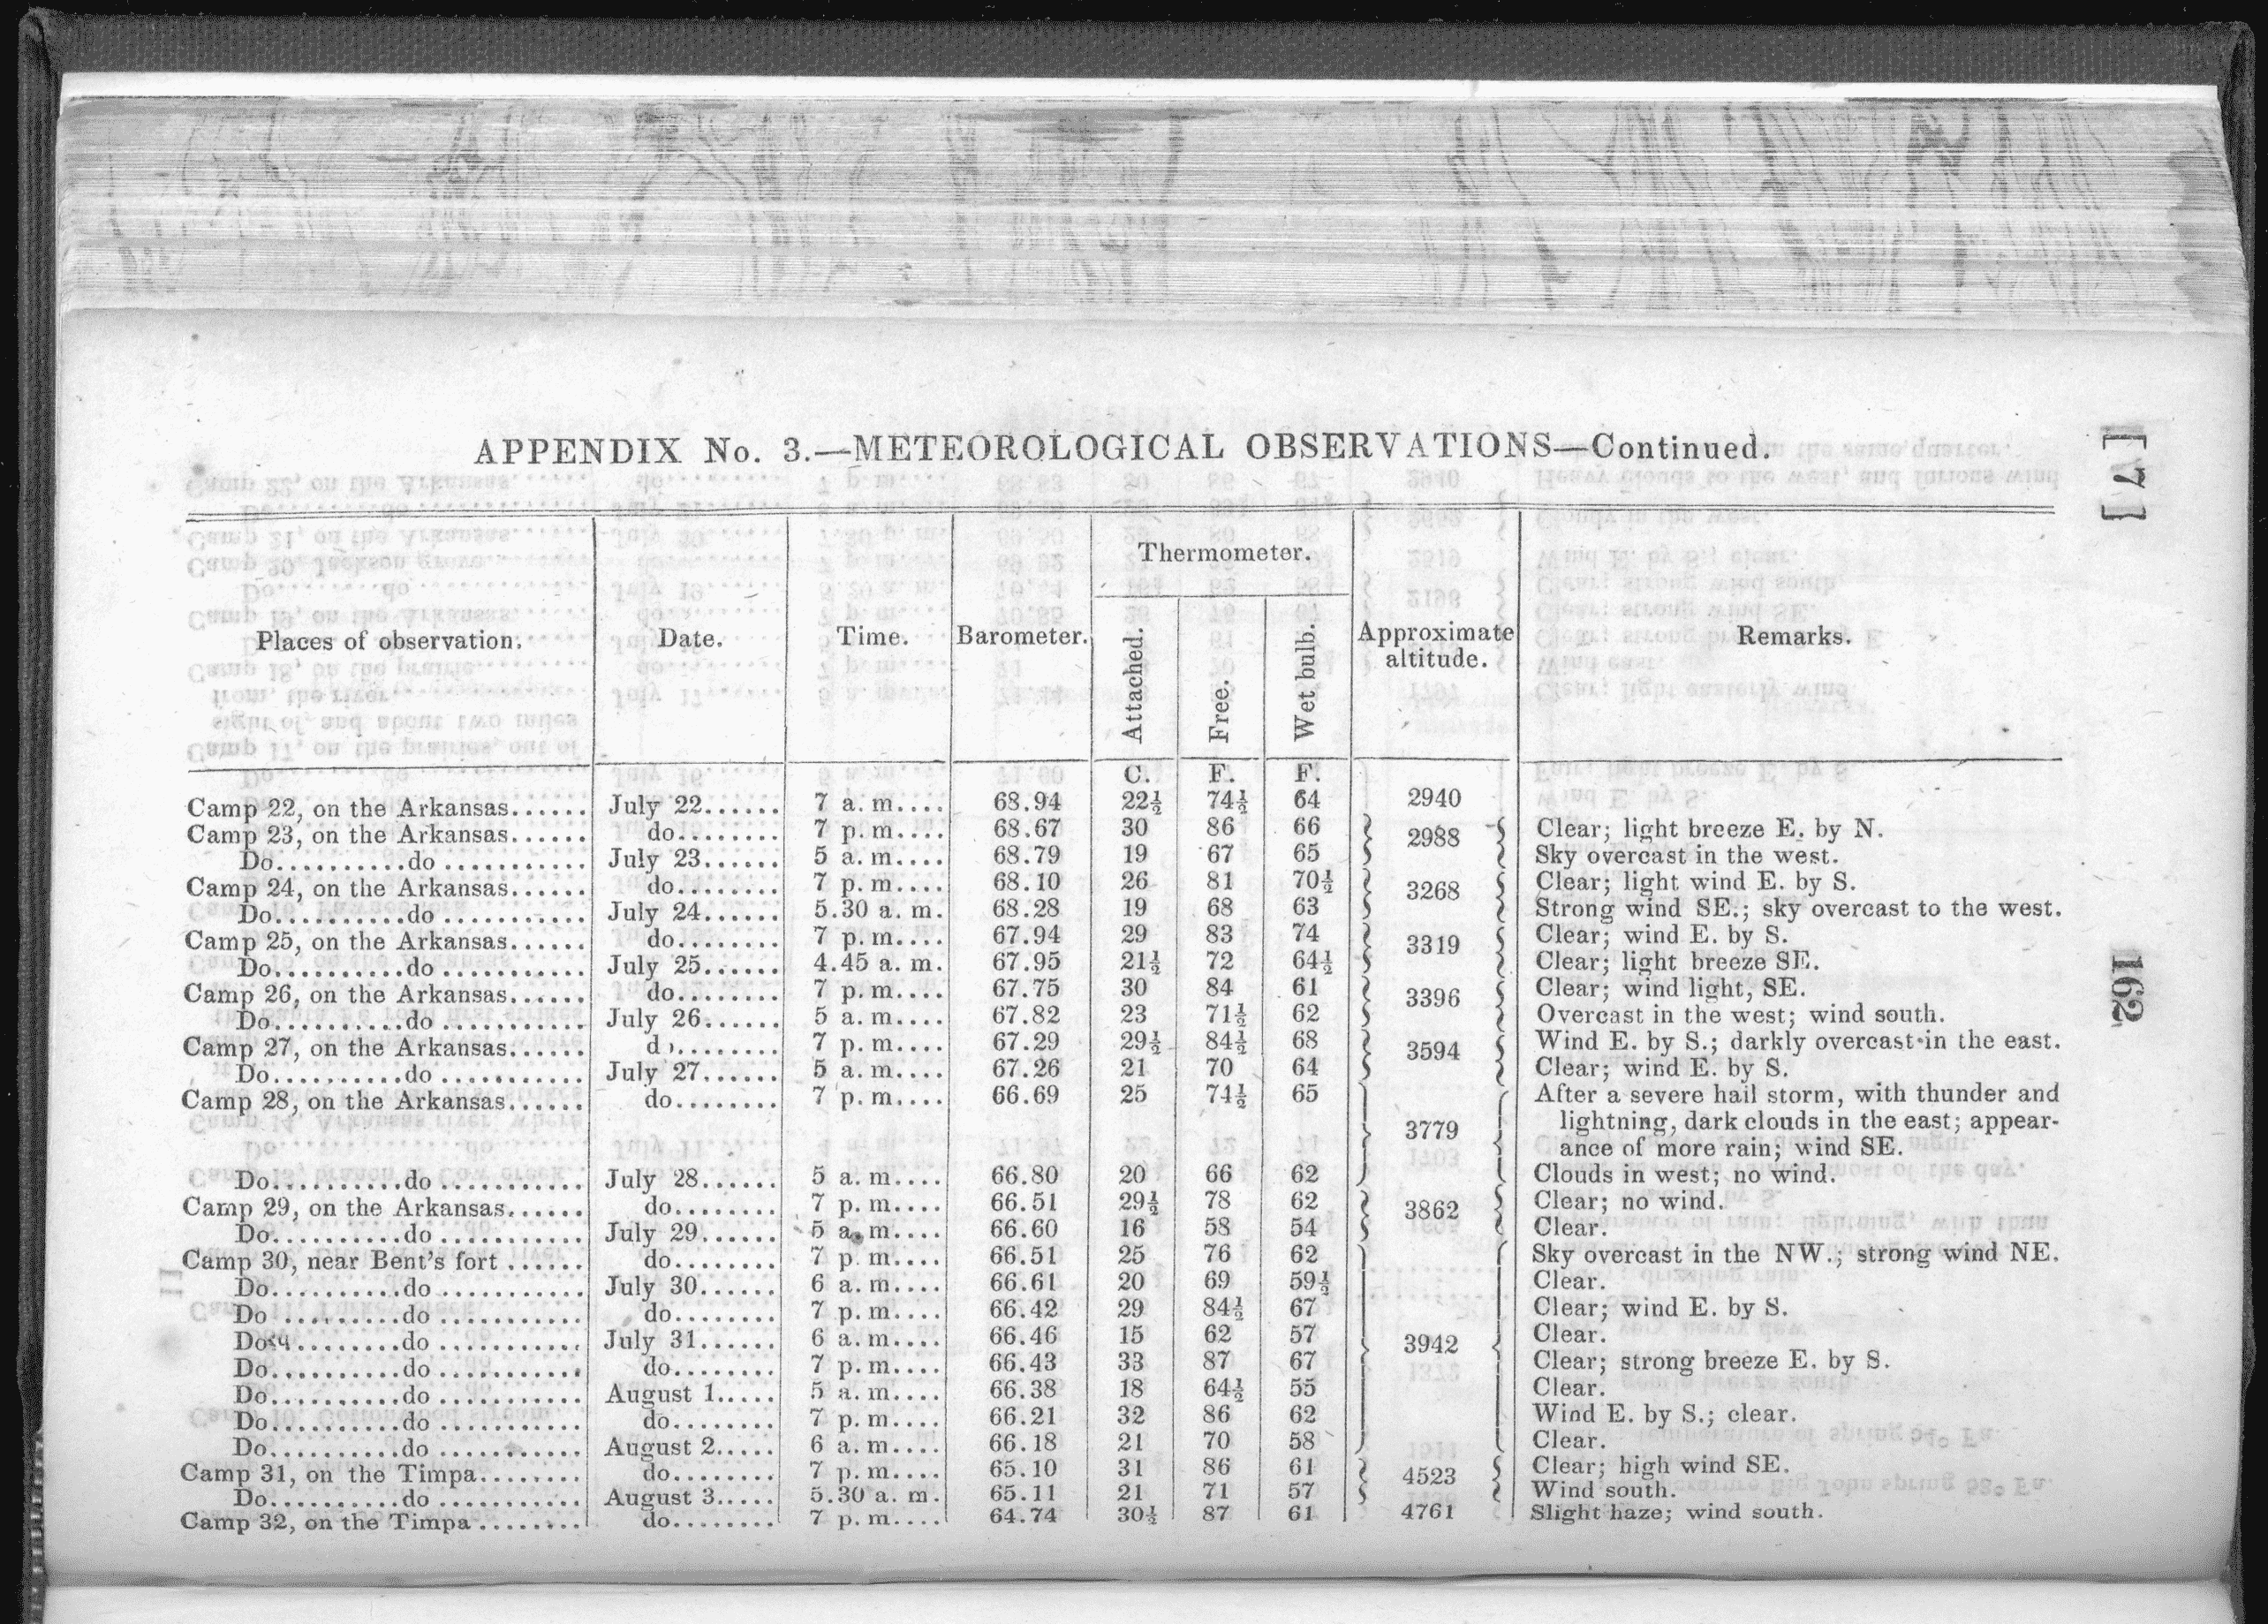
United States Army. Corps Of Topographical Engineers, and William H. Emory. Notes of a Military Reconnaissance,, from Fort Leavenworht, in Missouri, to San Diego, in California, including parts of the Arkansas, Del Norte, and Gila rivers. Washington, Wendell and Van Benthuysen, printers, 1848. Pdf. Retrieved from the Library of Congress, <www.loc.gov/item/rc01000181/>
This document provides a perfect blend of scientific inquiry, data-driven exploration, and narrative analysis of the many harrowing situations that are encountered on this journey Observing pages of this document with students might lead them to some significant questions, like:
- If this was a military mission, why did Emory spend so much time cataloging plants and people?
- What kinds of jobs, people, and equipment might Emory have needed in order to make his mission a success?
- What skills or tools would Emory need in order to measure the things that he measured, like location, the times of sunrise and sunset, elevation, and weather?
- If these calculations were incorrect, what are the potential consequences to these errors?
- If these calculations were correct, what are the potential benefits to having this information?
I paired this document with Daily Life in a Covered Wagon by Paul Erikson. While Emory and his men didn't travel in a covered wagon, this book provides excellent factual insights to the things they might have needed on the trail, as well as how much these things might have cost and weighed. It also goes into detail outlining some of the natural dangers that Emory and his men might have faced without getting into the gritty details Emory is sometimes forced to face on his military mission.
George Washington: Surveyor:
In relation to Emory's work surveying the American West, few know that, before George Washington was beloved American founding father, he spent much of his youth engaging in surveying as an occupation! Back then, it was perhaps among the most lucrative careers of the early Americas. This set focuses on a workbook owned by George Washington which helps illuminate his view of the world as he knew it (such as the existence of only four continents!) and some of the early surveys that Washington completed. It also provides a bit of insight as to how surveying was done with the use of Gunters Chains, something that could be done as an activity in any classroom! Consider a classroom creating a "survey" of their school or classroom using paperclip chains, and drawing the corresponding result!
-
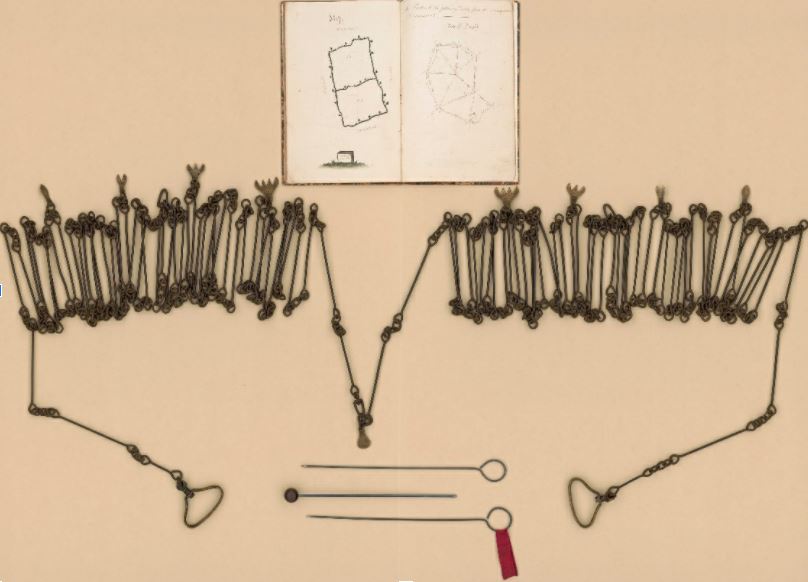
A 66 foot long Gunters Chain used for 18th century metes and bounds surveying in the colonies. Gunter, Edmond. [Gunters Chain], Library of Congress, Geography and Map Division. G9900 18- Vault
-
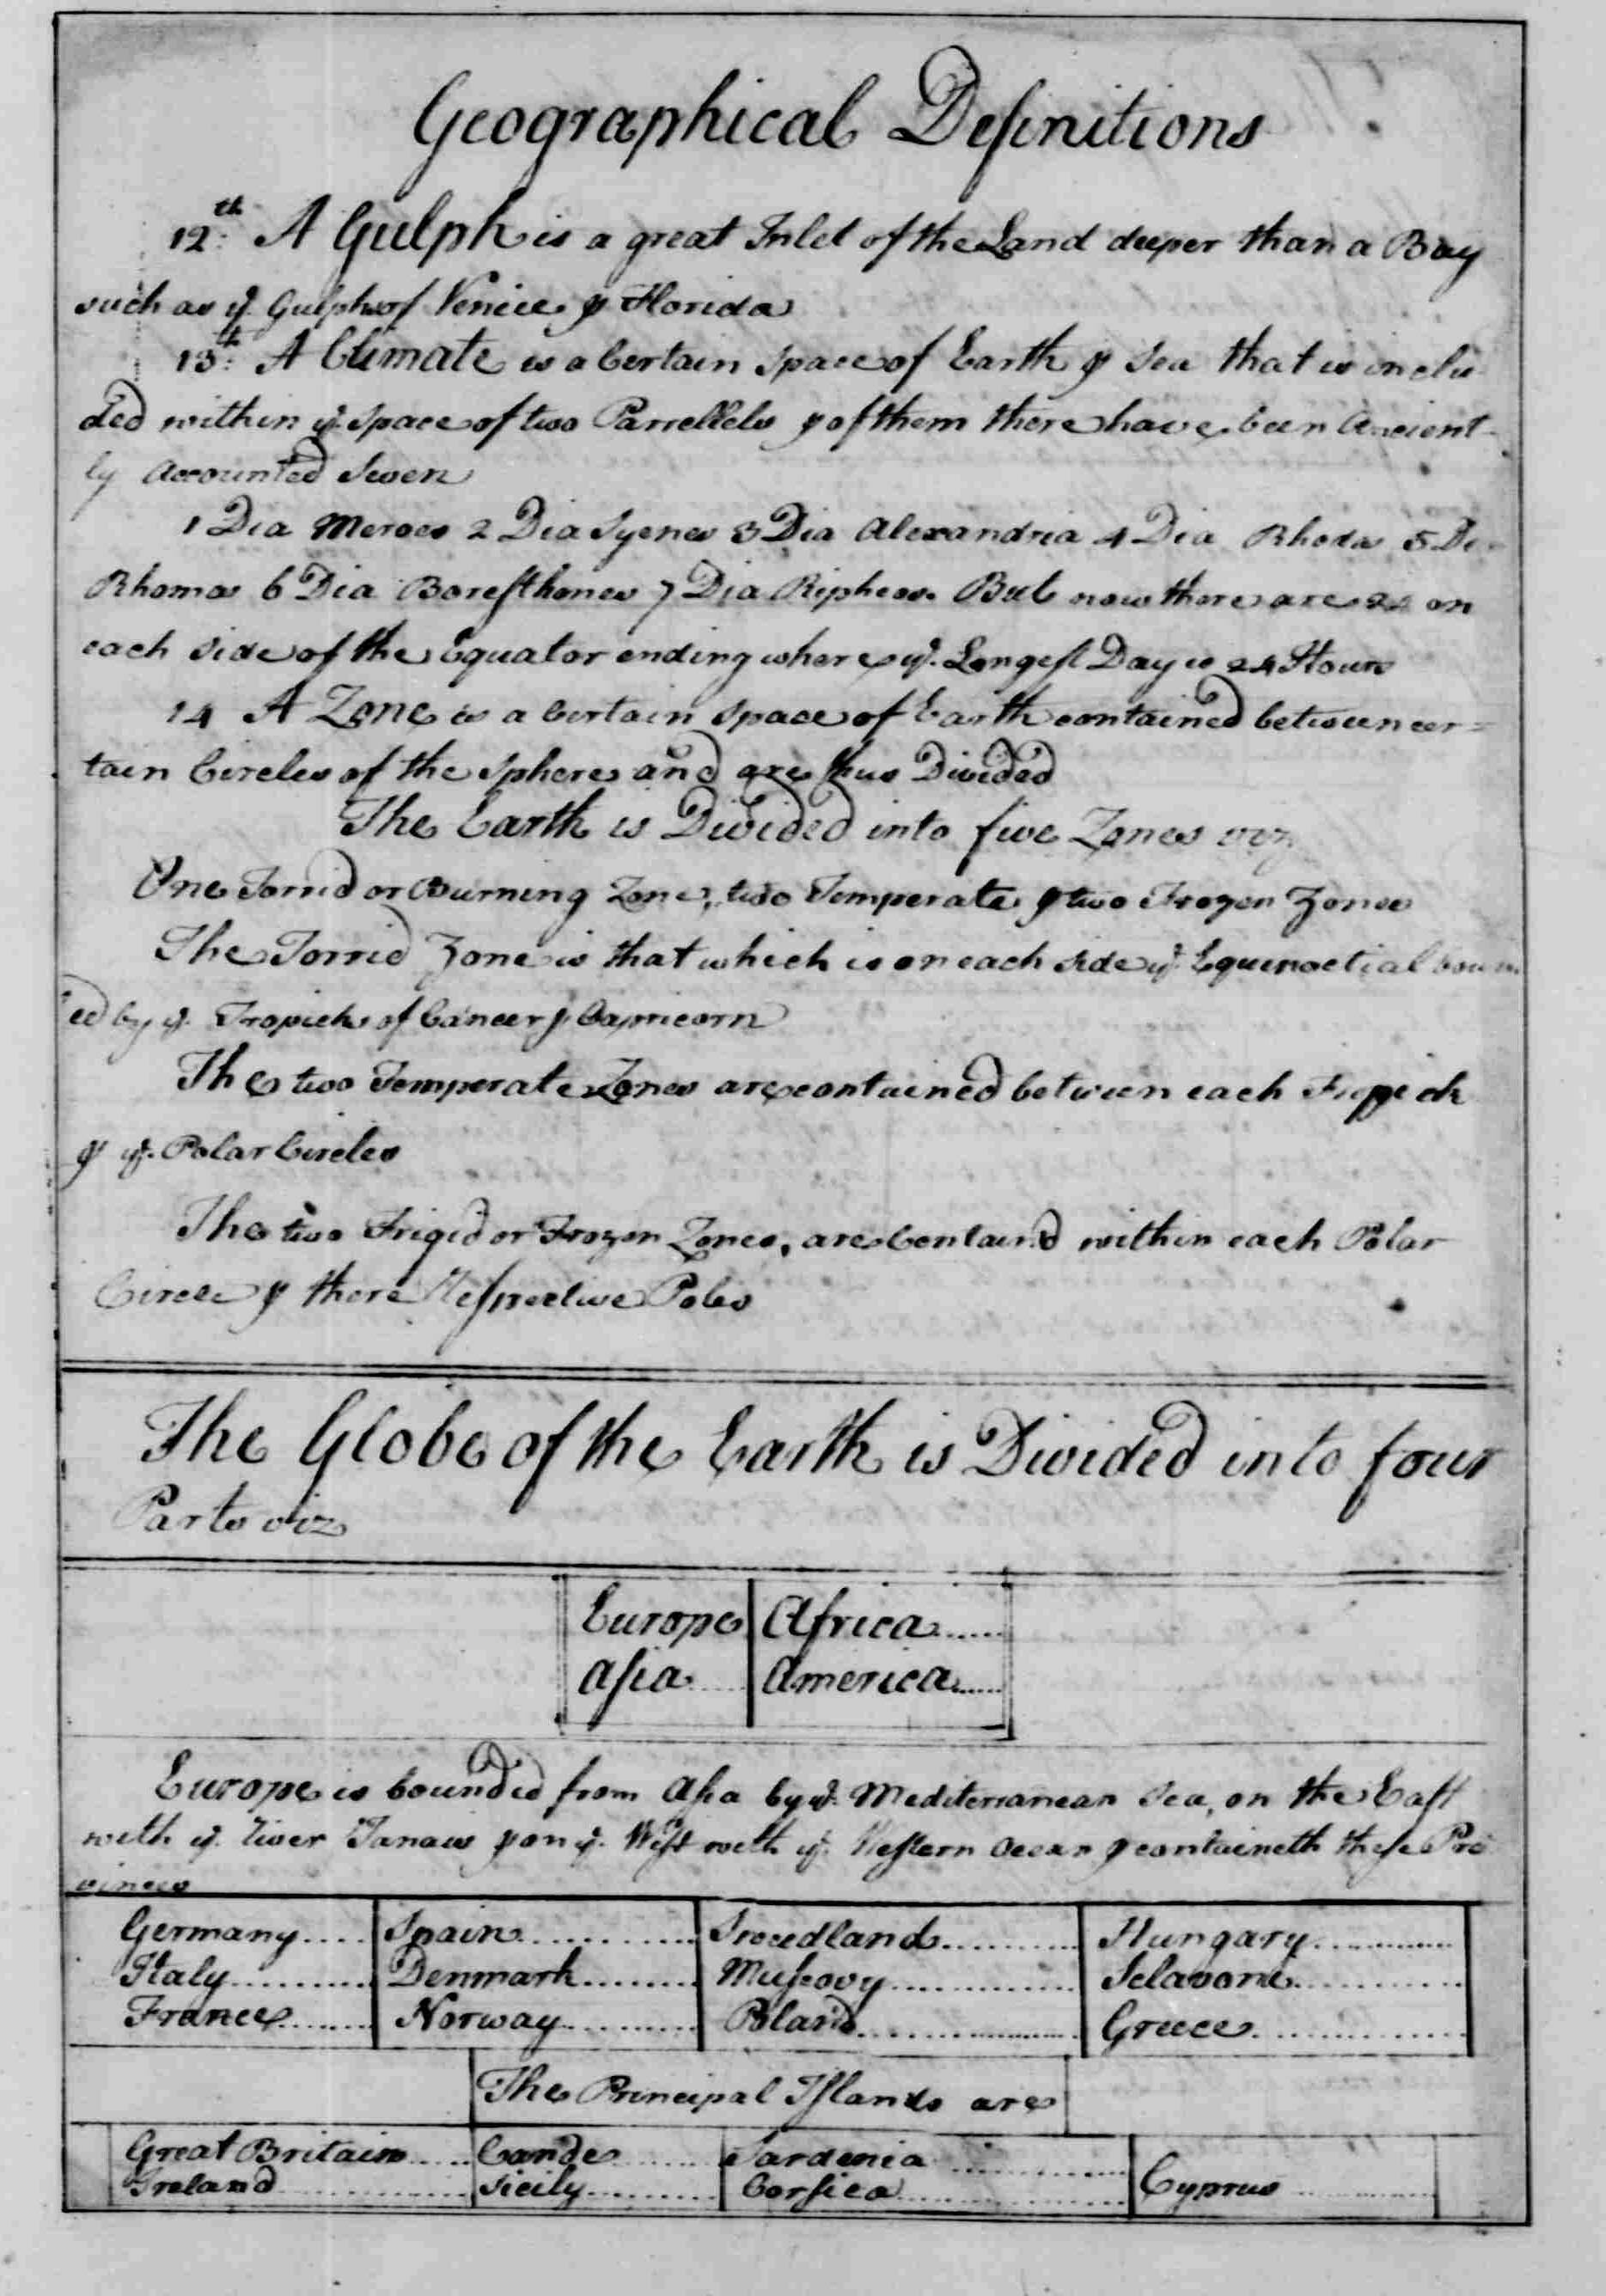
Washington, George. George Washington Papers, Series 1, Exercise Books, Diaries, and Surveys -99, Subseries 1A, Exercise Books -1747: School Copy Book, Volume 1. 1745. Manuscript/Mixed Material. Retrieved from the Library of Congress, <www.lov.gov/item/mgw1a.002/>
The text I paired with this is short, and is much more biographical than some of the others. It focuses on the classic history behind the man. The Story of George Washington by Lisa Trusiani has a great few pages on Washington's early life and the different elements of nature and society that he inevitably encountered.
The Census – An Essential American Activity:
When we think of engaging and exciting, the United States census might not always be the first thing that comes to mind. However, when one looks at the role that it has played in the construction of American society, its vital importance is undeniable. The census determines the number of seats a state gets within the House of Representatives and by extension, the Electoral College. By looking at the demographics of any census, it can begin to generate some interesting questions. Take this map, for example:
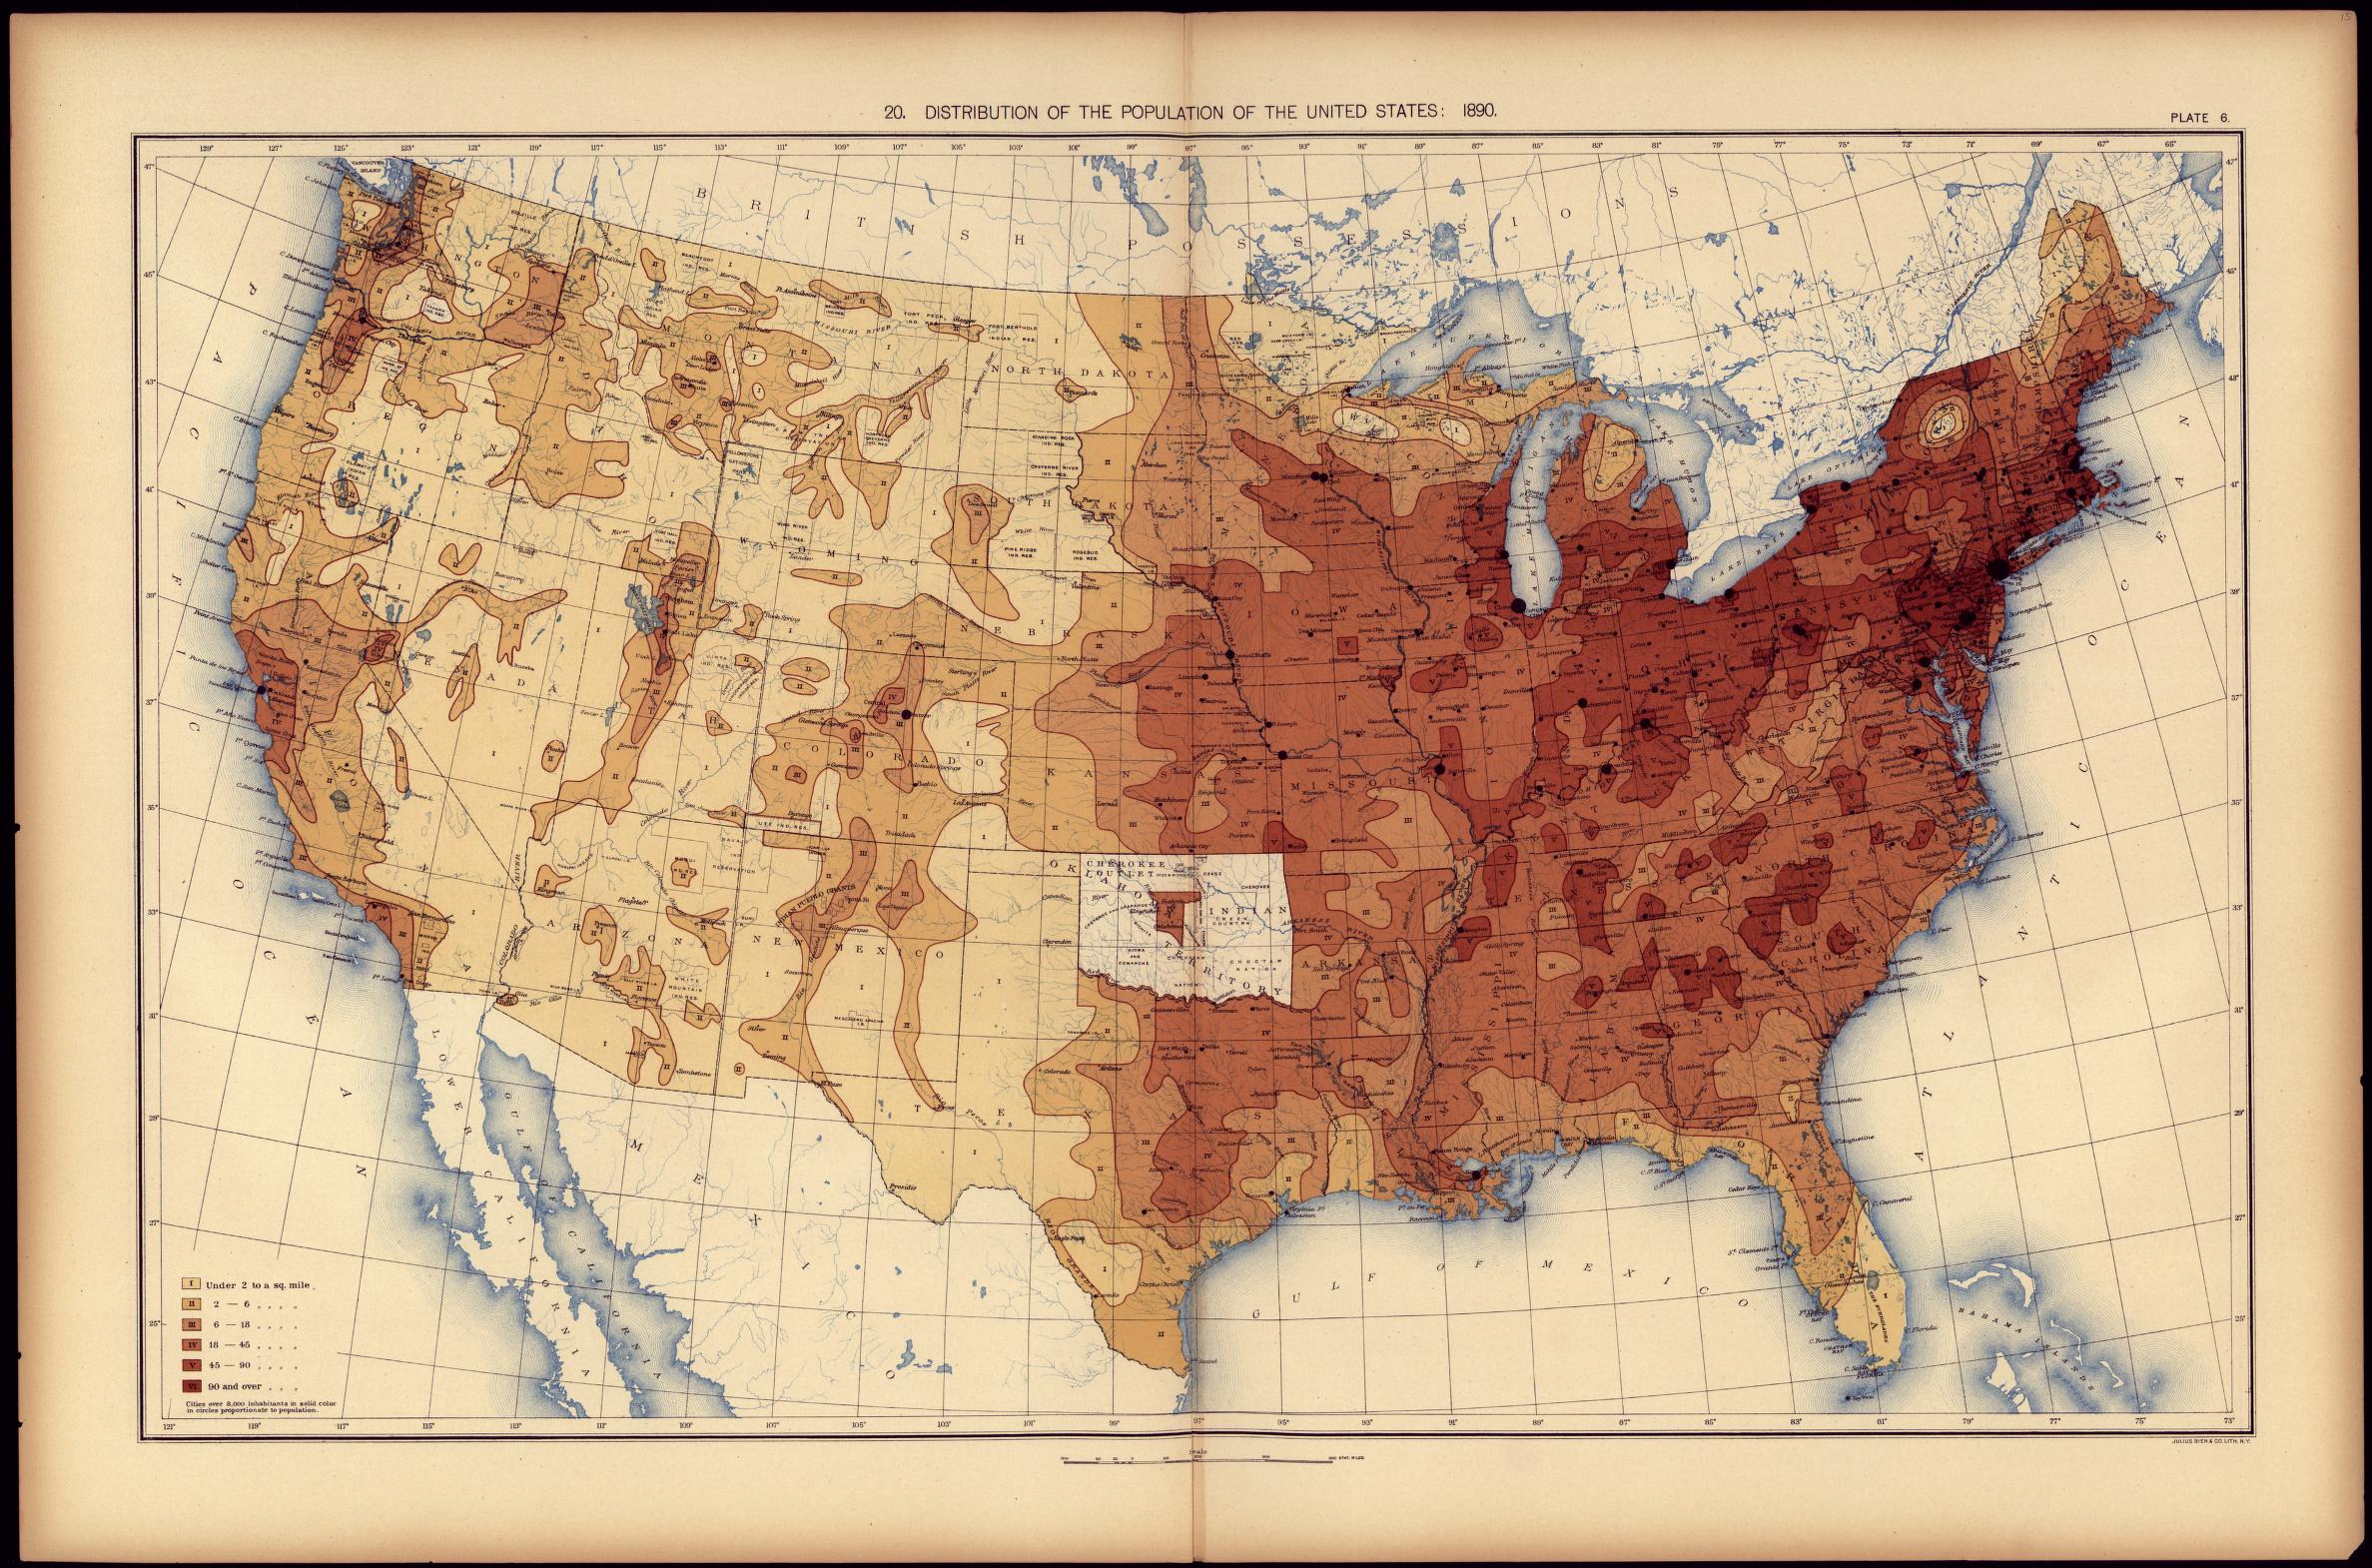
United States Census Office. 11th Census, 1890, and Henry Gannett. Statistical atlas of the United States, based upon the results of the eleventh census. Washington, Govt. print. off, 1898. Map. Retrieve from the Library of Congress <www.loc.gov/item/07019233>
First, some skills will be needed in order to decipher this map. What areas are the most populous and why? What cities might exist in those areas today? However, as further examination is given, students might notice some interesting items. For example:
- Why is there an enormous spot in modern day Oklahoma where absolutely "no one lives?"
- Why is there a random "bubble" in New York that is less settled than the surrounding areas?
- Why is southern Florida less settled than much of the American West?
- Why do populations almost "snake" through many areas of the West, where they almost "congregate" in the East?
It might be beneficial to allow a few minutes to examine this map and generate as many questions as you possibly can. Consider using sticky notes to mark notable areas on the document. Then, go through exploring the answers together. Answers to the first and third might lead you to conversations about Native American interactions, whereas answers to the second and fourth might lead you to an exploration of geography!
However, this discussion can be amplified when we consider the following map, which is derived from the same document.
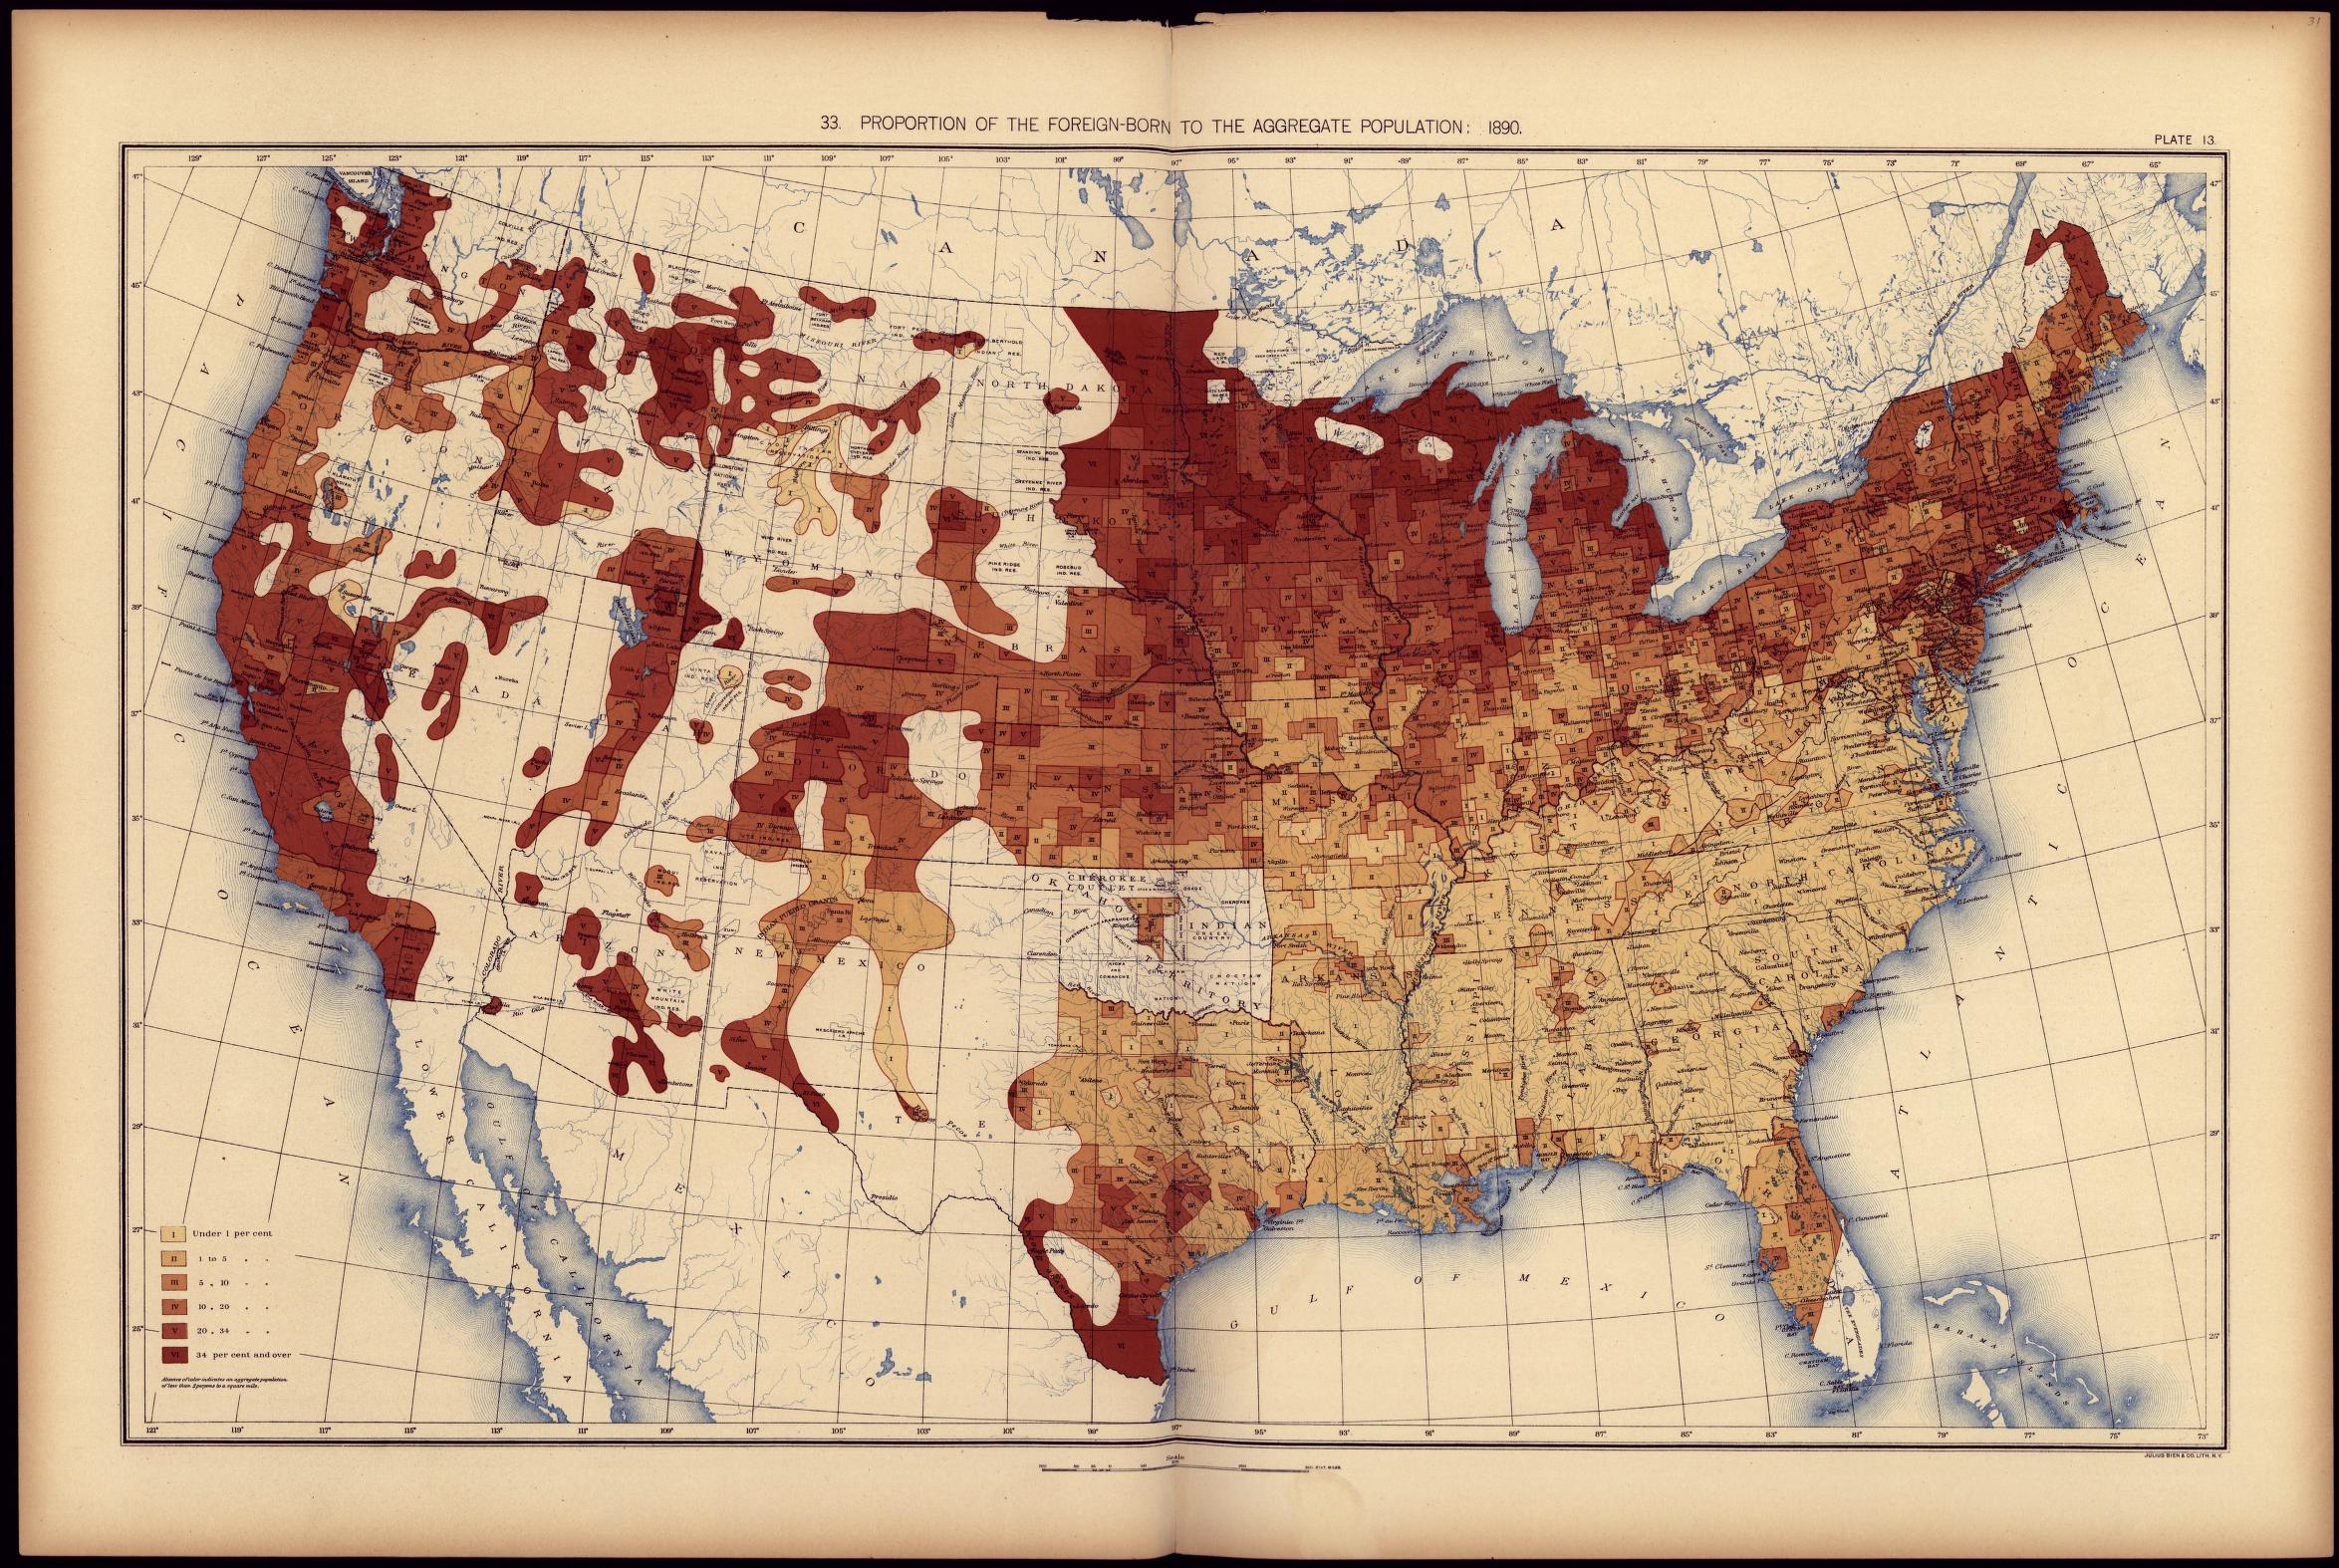
United States Census Office. 11th Census, 1890, and Henry Gannett. Statistical atlas of the United States, based upon the results of the eleventh census. Washington, Govt. print. off, 1898. Map. Retrieve from the Library of Congress <www.loc.gov/item/07019233>
This map analyzes the percentage of foreign-born populations within the United States. Compare this to the map above, and see what other questions you can naturally generate!
Finally, to really narrow in the mathematics of this lesson, I paired this map with the text If America Were a Village by David J. Smith. This excellent book puts our population into perspective - if the United States only had 100 people in it, what would those 100 people be like? What would their religion, race and culture be? Where would they live? Pairing this book with the 1990 census documents could serve as an excellent introduction to fractions, proportions, or percentages.
Women’s Suffrage:
Here, I attempted to place a specific focus on the mathematic and statistical implications of the concept of Women’s Suffrage, rather than solely focusing on the social. I think oftentimes, history is focused on women’s suffrage as an issue of a “woman’s role” in society, where many sought to maintain the traditional roles that had held our nation for years. Yet, the question of why so many fought to maintain these roles is often unasked. Examining the following map, obtained from the same census document, can begin to provide us some insights:
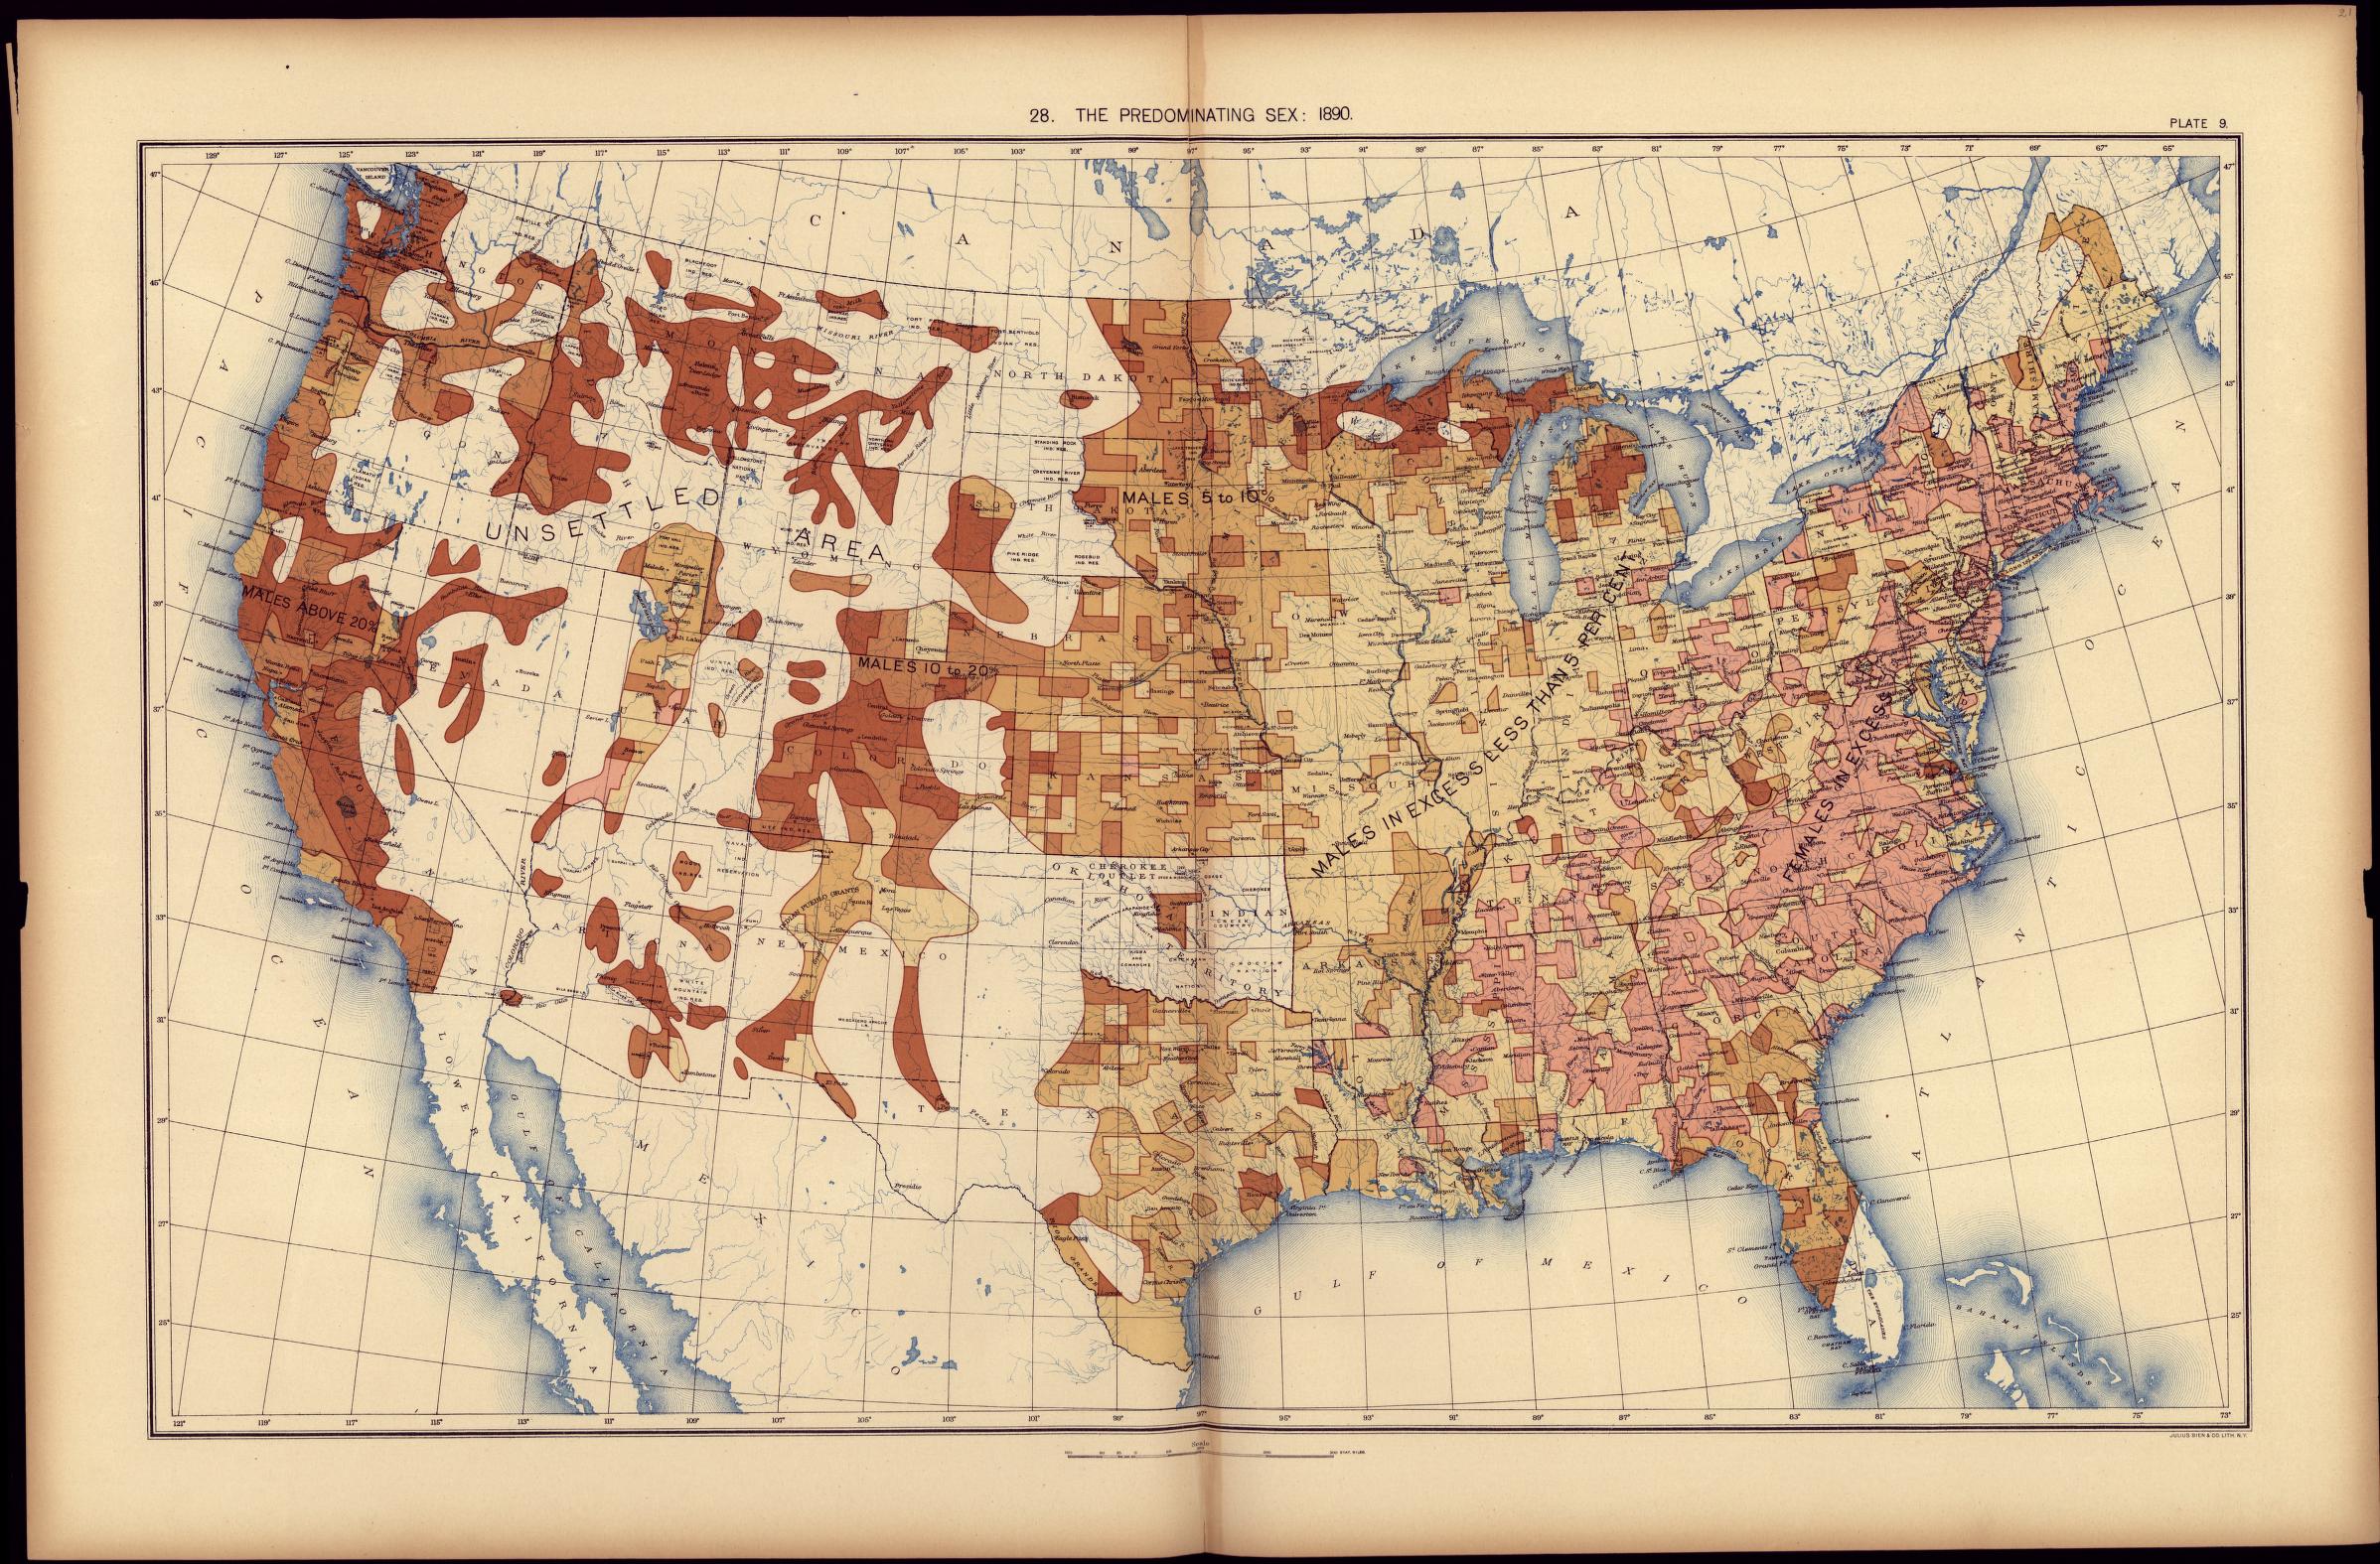
United States Census Office. 11th Census, 1890, and Henry Gannett. Statistical atlas of the United States, based upon the results of the eleventh census. Washington, Govt. print. off, 1898. Map. Retrieve from the Library of Congress <www.loc.gov/item/07019233/>
Examining this map forces us to ask questions like:
- Which states were the biggest advocates for women’s right to vote? States with an excess of men or an excess of women?
- Why are there so few women in the west compared to in the east? How might that have affected the societal structures of suffrage?
- Mathematically, what happens to the value of a vote when you open the right to vote to more people?
- If we compare this map to the following illustration, how does support for women’s suffrage appear to move across the country?
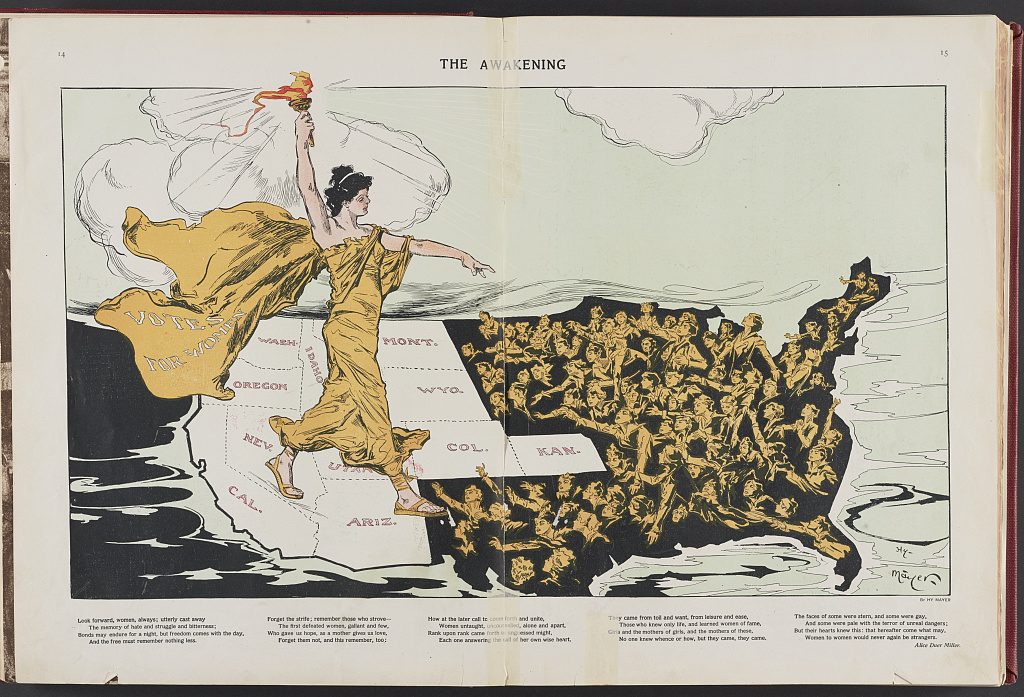
Mayer, Henry, Artist. The awakening / Hy Mayer. New York: Published by Puck Publishing Corporation, 295-309 Lafayette Street. Photograph. Retrieved from the Library of Congress, <www.loc.gov/item/98502844/>
Mathematically, examining Women's Suffrage can illuminate some of the problems with a democracy, if you allow it to. The larger a population, the less an individual vote is worth. With recent conversations surrounding the Electoral College, many are concerned that some states are given a much higher voting power, proportionally, than others. While this conversation may serve too advanced for a younger audience in elementary education, breaching these discussions early can prepare them for these difficult conversations later.
I paired this text with the book Marching with Aunt Susan by Claire Rudolph Murphy to provide a more narrative perspective to the issue of Women's Suffrage, as the primary sources themselves only provide a sliver of the story, often barred behind close analysis skills.
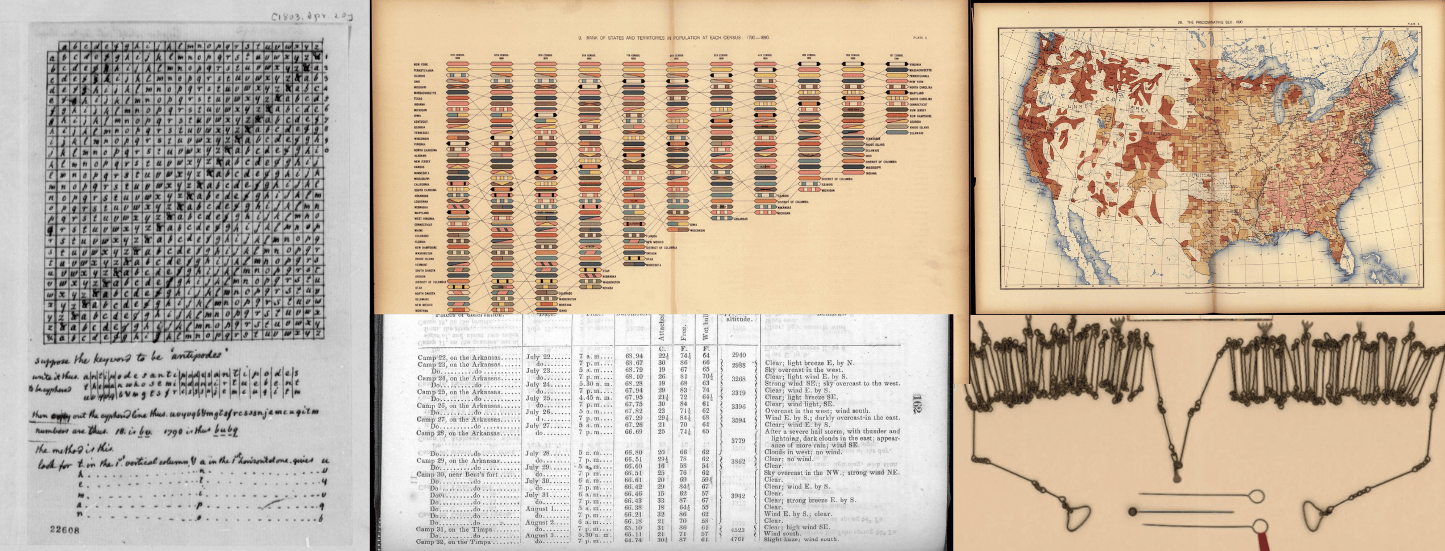
Ciphers:
I have a personal love for cryptography- when I was in high school, my best friend and I passed notes in a script that no one but us knew, so that if we were ever caught, the subjects of our conversation could not be discovered. While none of the ciphers I discuss in this set are inherently numerically based, it provides an entry point regarding the use of mathematics to encode, decode, or even construct language. This set could be paired to build intrigue with the “Into the American West” set that I mention above, due to its involvement of two notable expeditionary figures, being Lewis and Clark.
While many know the story of Lewis and Clark, few know the intense level of secrecy that Jefferson asked them to maintain. Jefferson insisted that communications be encoded in a series of various ciphers that contained pre-determined decoding keys (“Artichokes!”). This was because Lewis and Clark, on their journey to the Western coast, were moving through foreign territories, essentially acting as “spies” for the American government.
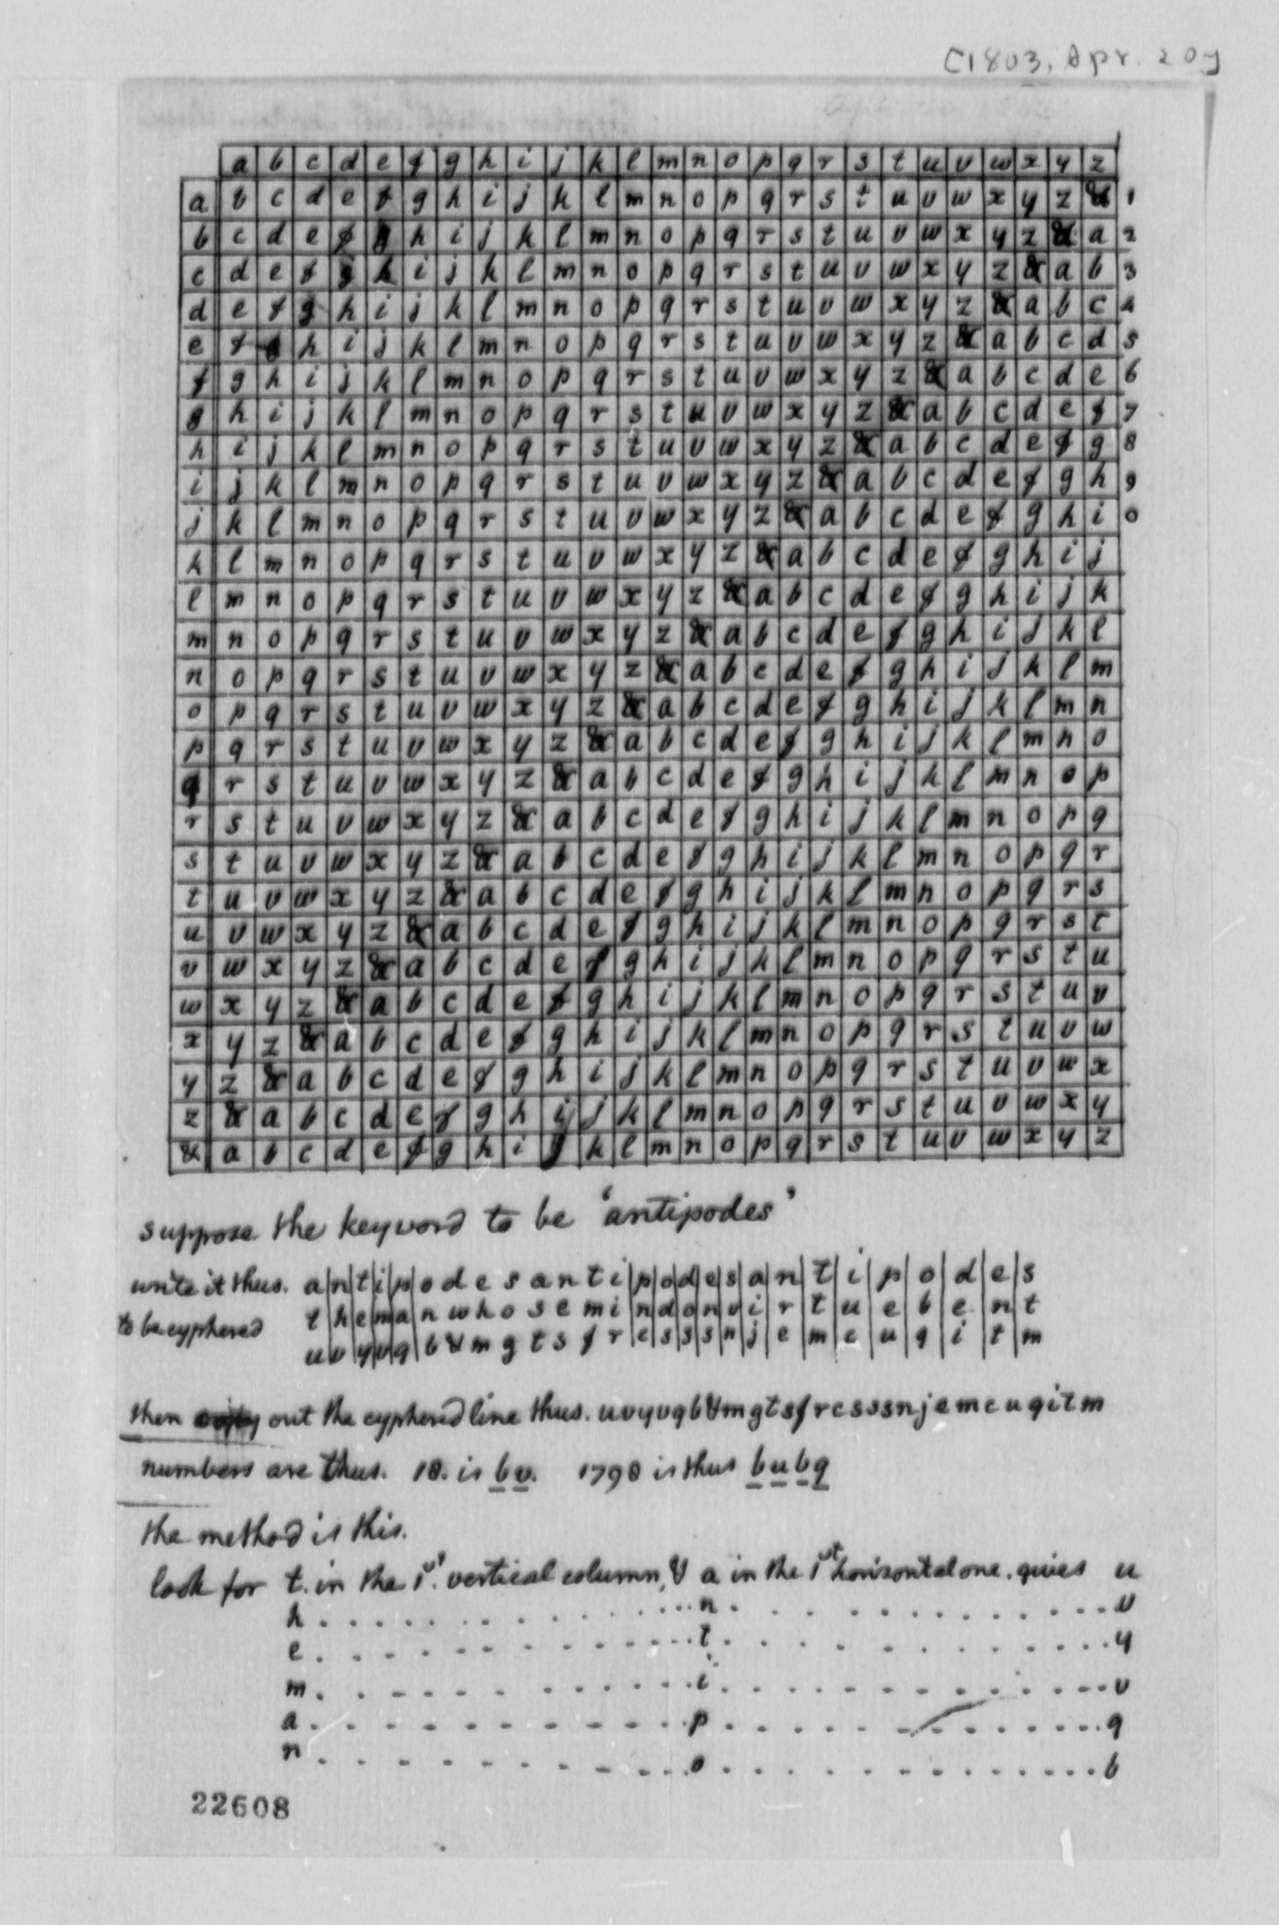
Thomas Jefferson to Meriwether Lewis, Cipher. -04-20, 1803. Manuscript/Mixed Material. Retrieved from the Library of Congress, <www.loc.gov/item/mtjbib012330/>
But there are many examples of other forms of ciphers being used in American society, too, and for a number of varied purposes. The use of Morse code in telegraphing played a pivotal role in long-distance communications as a well-known substitution cipher. Navajo Code Talkers’ ciphers during World War II still remain one of the only codes unbroken during active wartime. Today, binary substitutions lay the foundation for modern day technology!
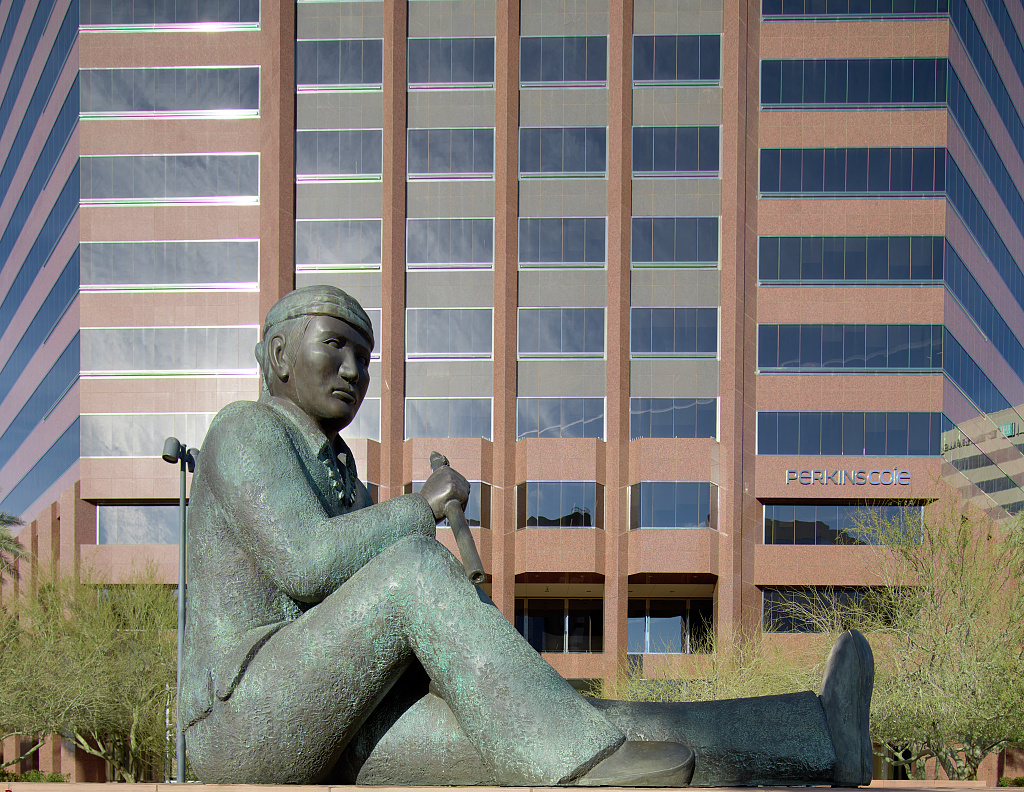
Highsmith, Carol M, photographer. Tribute to Navajo Code Talkers by artist Doug Hyde, creating in downtown Phoenix. -02-24. Photograph. Retrieved from the Library of Congress, <www.loc.gov/item/2018703819/>
While many ciphers aren’t inherently mathematical, they do teach students the ability to research, problem solve, and test out theories to find the right answers. To me, this is the very basis of mathematical thinking. I paired this text with Chester Nez and the Unbreakable Code by Joseph Bruchac, as the story of the Navajo Code Talker's is one that always inspired and resonated with me- it is because of the diversity of America that we were able to produce a cipher that no country could crack. Rather than looking to divide, we should be looking to see how we can utilize the skills and concepts of other cultures to enhance the work that we do. This book could also be paired with an interview of Chester Nez, available through the Library's digital collections, or the book kit created through partnership with TPS Consortium member, Southern Illinois University - Edwardsville.